

Physical AI Market
Physical AI Market (Component: Hardware, Software and Services; Technology: Computer Vision, Reinforcement Learning & Control Systems, Speech/NLP, Gesture & Movement Recognition and Others; Robot Type: Industrial Robots, Humanoid Robots, Collaborative Robots, Mobile Robots and Others; End-use Industry: Manufacturing, Automotive, Logistics & Warehousing, Healthcare, Defense & Security and Others) – Global Industry Analysis, Shares, Growth, Trends and Forecast 2021-2036
| Format: PDF/PPT/Excel
| Product ID:
4755
| Report Version:
July 2026
- Report Preview
- Table of Content
- Request Customization
Market Snappshot
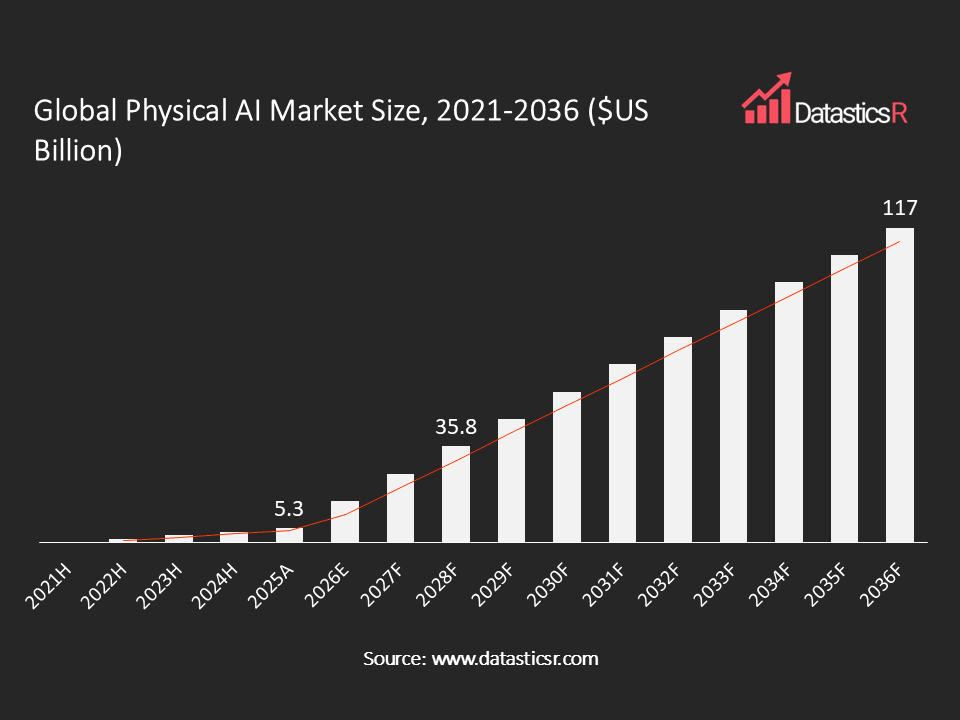
- Market Size in 2025: $US 5.3 Bn
- Forecast Market by 2036: $US 117 Bn
- CAGR for the Period 2026-2036: 22.4%
- Top Region in Terms of Market Share: North America (40%)
- Key Players: NVIDIA Corporation, Tesla, Boston Dynamics, Figure AI, Agility Robotics, ABB Ltd., FANUC Corporation, Kuka AG, Siemens, SoftBank Robotics Group, Toyota Motor Corporation, Google DeepMind, and Others
Analyst Viewpoint:
Physical AI is the point where two separate hype cycles, foundation models and humanoid robotics, are colliding into one category, and it’s worth being clear-eyed about what’s real versus what’s narrative. The genuine substance is in the software layer: vision-language-action models are starting to let a single robot control system generalize across different physical tasks and even different robot bodies, which is a real architectural shift from the single-purpose robotic arms that dominated industrial automation for decades. What’s less settled is the hardware side. Humanoid robots get the headlines, but plenty of practical automation work, sorting, inspection, material handling, doesn’t actually need a bipedal, human-shaped machine, and companies chasing the humanoid narrative purely for investor appeal may be solving a harder engineering problem than their use case requires. The more durable winners are likely to be platforms that stay form-factor agnostic and let the software layer do the generalizing, rather than betting everything on one physical shape. The capital flowing into this space right now is genuinely unusual in scale, and that’s both a tailwind and a risk. It’s accelerating real technical progress, but it also means a meaningful correction is plausible once investors start distinguishing between companies with deployed, revenue-generating systems and companies still operating at demonstration scale.
Physical AI Market Overview:
Physical AI is the term for artificial intelligence that is physically integrated into machines, robots, and vehicles and is capable of perception, cognition, and action in the physical world through the integration of foundation models, simulation, and compute at the edge as opposed to AI’s current digital-only operation. It represents a convergence of two previously separate fields: large-scale AI model development and industrial robotics hardware.
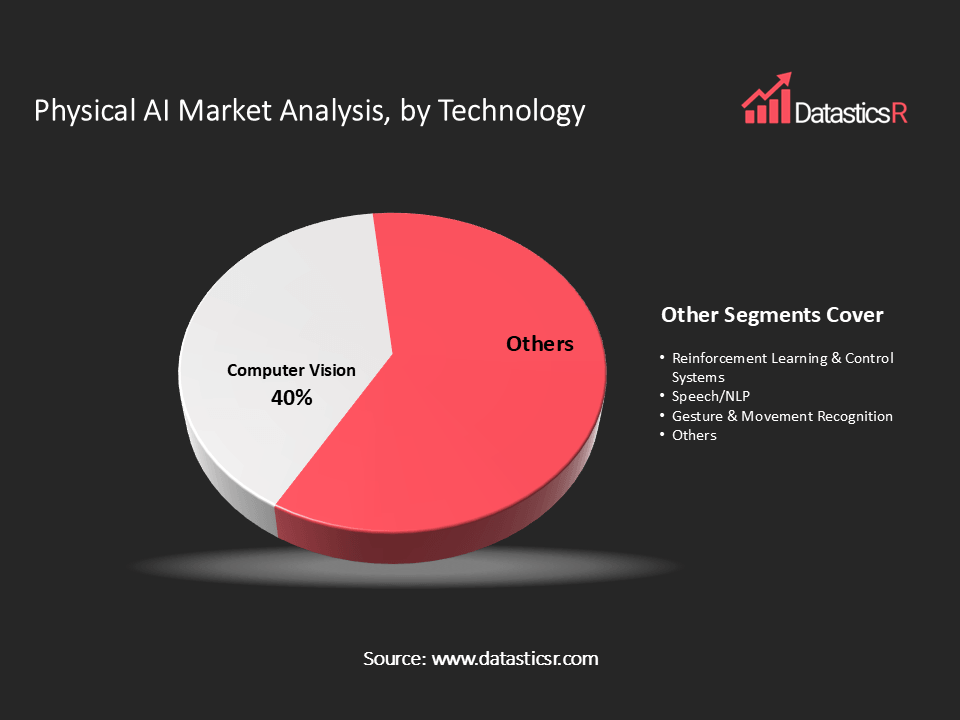
By component, hardware leads with an estimated 55% share, reflecting the current dominance of sensors, actuators, AI processing chips, and mechatronic assemblies as the primary cost driver in physical AI systems, though software is the fastest-growing component as foundation models, simulation platforms, and robotic operating systems mature. As far as technology goes, computer vision takes first place with a share of roughly 40%, becoming the key technological base for object detection, navigation, and environment mapping in virtually all applications of physical AI. As for robot type, today industrial robots are the dominant type with a market share of about 38%, yet humanoid robots are the fastest-growing type of robots, becoming the most popular one, with expecting investments into humanoid robotics to amount to $50 billion by 2036. By end-use industry, manufacturing and automotive leads with an estimated 23% share, while healthcare is projected to grow at the fastest rate of any application as robotic surgery and care-assistance systems scale.
The market has been moving definitely from research demo purposes to commercialization purposes for the last couple of years, with the cumulative investment into physical AI having reportedly crossed $100 billion mark by late 2025.
By component, hardware leads with an estimated 55% share, reflecting the current dominance of sensors, actuators, AI processing chips, and mechatronic assemblies as the primary cost driver in physical AI systems, though software is the fastest-growing component as foundation models, simulation platforms, and robotic operating systems mature. As far as technology goes, computer vision takes first place with a share of roughly 40%, becoming the key technological base for object detection, navigation, and environment mapping in virtually all applications of physical AI. As for robot type, today industrial robots are the dominant type with a market share of about 38%, yet humanoid robots are the fastest-growing type of robots, becoming the most popular one, with expecting investments into humanoid robotics to amount to $50 billion by 2036. By end-use industry, manufacturing and automotive leads with an estimated 23% share, while healthcare is projected to grow at the fastest rate of any application as robotic surgery and care-assistance systems scale.
The market has been moving definitely from research demo purposes to commercialization purposes for the last couple of years, with the cumulative investment into physical AI having reportedly crossed $100 billion mark by late 2025.
| Drivers | Convergence of Foundation Models and Robotics Enabling General-Purpose Automation |
| Surging Capital Investment and Labor Shortage Pressure Across Manufacturing and Logistics |
Convergence of Foundation Models and Robotics Enabling General-Purpose Automation
The core technical driver behind physical AI is a genuine architectural shift: robots are moving from single-purpose, hard-coded machines toward general-purpose systems controlled by foundation models that can generalize across tasks and, increasingly, across different robot bodies. NVIDIA’s release of its Cosmos and GR00T open robotics foundation models at CES in January 2025 was a major catalyst here, drawing over 500 robotics developers into its ecosystem within a short window and effectively establishing shared infrastructure that smaller robotics companies can build on rather than developing foundation models from scratch.
Major AI labs are moving decisively into embodiment too. Google DeepMind partnered with Apptronik in December 2024 to integrate its Gemini Robotics AI directly into the Apollo humanoid platform, later expanding its trusted-tester ecosystem to include Boston Dynamics and Agility Robotics, a sign that frontier AI labs increasingly see physical embodiment as a core testing ground for their models, not a side project. Investment has followed accordingly: Figure AI raised $2.6 billion from an investor group including NVIDIA, OpenAI, Microsoft, and Amazon, one of the largest funding rounds in robotics history.
Vision-language-action models specifically are the technical mechanism making this generalization possible, translating visual input and natural-language instructions directly into physical robot actions without task-specific reprogramming. As these models mature and simulation platforms make training safer and cheaper, the gap between a robot demonstrated in a lab and one deployed on a real production floor continues to narrow.
Major AI labs are moving decisively into embodiment too. Google DeepMind partnered with Apptronik in December 2024 to integrate its Gemini Robotics AI directly into the Apollo humanoid platform, later expanding its trusted-tester ecosystem to include Boston Dynamics and Agility Robotics, a sign that frontier AI labs increasingly see physical embodiment as a core testing ground for their models, not a side project. Investment has followed accordingly: Figure AI raised $2.6 billion from an investor group including NVIDIA, OpenAI, Microsoft, and Amazon, one of the largest funding rounds in robotics history.
Vision-language-action models specifically are the technical mechanism making this generalization possible, translating visual input and natural-language instructions directly into physical robot actions without task-specific reprogramming. As these models mature and simulation platforms make training safer and cheaper, the gap between a robot demonstrated in a lab and one deployed on a real production floor continues to narrow.
Surging Capital Investment and Labor Shortage Pressure Across Manufacturing and Logistics
The second major driver is more straightforwardly economic: persistent labor shortages in manufacturing and logistics are pushing companies toward automation at a pace that’s attracting enormous capital investment. Over 70% of global manufacturers reportedly plan to increase investment in robotics and AI-driven automation specifically to address labor shortages and improve efficiency, according to industry research covering the space.
Capital markets have responded with unusual intensity. It is reported that investment in robotics technology has increased by 300% quarter on quarter in the fourth quarter of 2025, while the cost of manufacturing for humanoid robots has decreased by 40% from 2023 to 2024, a significant decrease which could potentially affect their economic viability. The research version of humanoid robots like the G1 model of Unitree is available for $16,000, a fraction of what comparable robotic systems cost just a few years earlier.
Logistics has become a particularly visible proving ground for this investment. Last-mile delivery costs can account for up to 53% of total shipping expense, according to industry estimates, making embodied AI robots for warehouse and delivery automation an unusually direct return-on-investment case compared to more experimental physical AI applications elsewhere.
Capital markets have responded with unusual intensity. It is reported that investment in robotics technology has increased by 300% quarter on quarter in the fourth quarter of 2025, while the cost of manufacturing for humanoid robots has decreased by 40% from 2023 to 2024, a significant decrease which could potentially affect their economic viability. The research version of humanoid robots like the G1 model of Unitree is available for $16,000, a fraction of what comparable robotic systems cost just a few years earlier.
Logistics has become a particularly visible proving ground for this investment. Last-mile delivery costs can account for up to 53% of total shipping expense, according to industry estimates, making embodied AI robots for warehouse and delivery automation an unusually direct return-on-investment case compared to more experimental physical AI applications elsewhere.
Physical AI Regional Market Outlook:
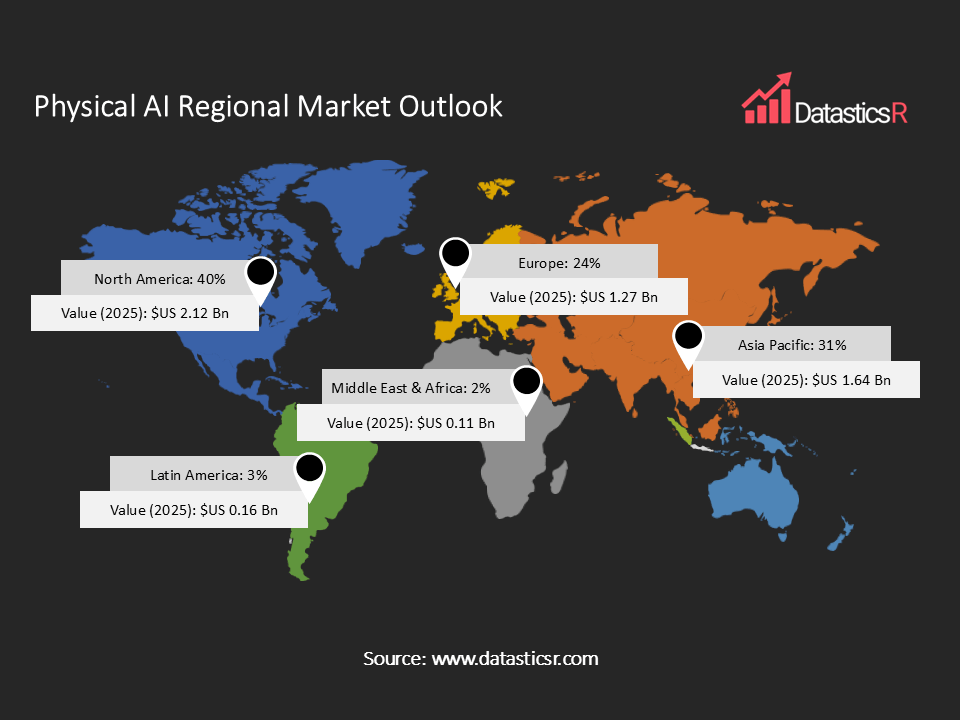
North America is the dominating region in terms of physical AI implementation, which has an estimated market share of 40% because of prominent companies like NVIDIA, Tesla, Boston Dynamics, Agility Robotics, considerable investment of venture capital and use of enterprises in manufacturing, health care and defense industries.
Asia Pacific possesses an estimated 31% share, although it is the fastest-growing region due to China’s national robotics policy requirements, legacy automation tradition in Japan, electronics manufacturing in South Korea, and logistics industry growth in India.
Europe takes the second place with an estimated 24% share due to established industrial robotics players like Siemens and Kuka, as well as relatively conservative adoption practices.
Latin America possesses an estimated 3% share due to growing investments in automotive and logistics automation. Middle East & Africa possess the smallest estimated share of 2%.
Asia Pacific possesses an estimated 31% share, although it is the fastest-growing region due to China’s national robotics policy requirements, legacy automation tradition in Japan, electronics manufacturing in South Korea, and logistics industry growth in India.
Europe takes the second place with an estimated 24% share due to established industrial robotics players like Siemens and Kuka, as well as relatively conservative adoption practices.
Latin America possesses an estimated 3% share due to growing investments in automotive and logistics automation. Middle East & Africa possess the smallest estimated share of 2%.
Key Companies in Physical AI Market:
There is competition among three main categories of companies: AI compute and foundation models providers creating the intelligence layer, industrial robotics companies benefiting from years of experience in manufacturing and deploying globally, and young humanoid robotics firms gaining substantial venture funding for development. The competition is gradually moving away from mechanical capabilities to the software, simulations, and foundation models that empower robots with the perception, reasoning, and adaptation capabilities. On the other hand, existing robotics companies keep taking advantage of their huge installed base, manufacturing processes, and established relationships with customers, whereas new robotics companies innovate in embodied AI, humanoid locomotion, and next-generation autonomous robots. In the context of Physical AI, the success depends on the combination of AI models, software, and robotics hardware.
Key players include NVIDIA Corporation, Tesla, Boston Dynamics, Figure AI, Agility Robotics, ABB Ltd., FANUC Corporation, Kuka AG, Siemens, SoftBank Robotics Group, Toyota Motor Corporation, Google DeepMind, Hyundai Motor Group, Amazon, Unitree Robotics and Others.
Key players include NVIDIA Corporation, Tesla, Boston Dynamics, Figure AI, Agility Robotics, ABB Ltd., FANUC Corporation, Kuka AG, Siemens, SoftBank Robotics Group, Toyota Motor Corporation, Google DeepMind, Hyundai Motor Group, Amazon, Unitree Robotics and Others.
Key Developments in Physical AI Market:
| 1. NVIDIA Launches Cosmos 3, the Open Frontier Foundation Model for Physical AI: In May, 2026, NVIDIA launched NVIDIA Cosmos™ 3, an open world foundation model for physical AI built on a breakthrough mixture-of-transformers architecture that combines vision reasoning, world generation and action prediction in a single system. Cosmos 3 is the world’s first fully open omnimodel that can natively understand and generate text, images, video, ambient sound and actions with leading physics accuracy, reducing physical AI training and evaluation cycles from months to days. |
| 2. Cognizant Launches Sovereign Physical AI Platform-as-a-Service: In June, 2026, Cognizant launched an industry leading sovereign Physical AI Platform-as-a-Service, an integrated capability that moves autonomous systems from experimentation into core enterprise infrastructure. |
Physical AI Market Attributes:
| ATTRIBUTE | DETAILS |
| Market Value, 2025 | $US 5.3 Billion |
| Forecasted Market Value, 2036 | $US 117 Billion |
| CAGR (2026-2036) | 22.4% |
| Analysis Period | 2021-2036 |
| Historic Period | 2021-2024 |
| Base Year | 2025 |
| Forecast Period | 2026-2036 |
| Volume Unit | NA |
| Value Unit | $US Billion |
| Market Segmentation | By Component
By Technology
By Robot Type
By End-use Industry
By Region
|
| Companies Profiles |
|
| Customization Request | Available upon request |
1. Introduction
1.1. Report Scope
1.2. Market Segmentations and Definitions
1.3. Geographical Coverage
2. Executive Summary
2.1. Key Facts and Figures
2.2. Trends Impacting the Market
2.3. DatasticsR Growth Opportunity Matrix
3. Market Overview
3.1. Global Physical AI Market Analysis and Forecast, 2021-2036
3.1.1. Global Physical AI Market Size ($US Bn)
3.2. Key Market Trends
3.3. Technology Roadmap and Developments
3.4. Market Dynamics
3.4.1. Drivers
3.4.2. Restraints
3.4.3. Opportunities
3.5. Porter’s Five Forces Analysis
3.6. PESTL Analysis
3.7. Industry SWOT Analysis
3.8. Regulatory Landscape
3.9. Value Chain Analysis
3.9.1. List of Hardware Providers
3.9.2. List of Software Providers
3.9.3. List of Robotics Companies
3.9.4. List of Service Providers
3.9.5. List of Potential Customers
3.10. Impact of Current Geopolitical Scenario on the Market
4. Technical Analysis
4.1. Technical Specification Analysis
4.2. Details of System Integration Process
4.3. Technology Adoption and Emerging Technologies
4.4. R&D Trends and Patents Landscape
4.5. Cost Structure and Profitability Analysis
5. Global Physical AI Investments ($US Bn), by Region, 2025
5.1. North America
5.2. Europe
5.3. Asia Pacific
5.4. Latin America
5.5. Middle East and Africa
6. Global Physical AI Market Analysis and Forecasting ($US Bn), by Component, 2021-2036
7. Global Physical AI Market Analysis and Forecasting ($US Bn), by Technology, 2021-2036
8. Global Physical AI Market Analysis and Forecasting ($US Bn), by Robot Type, 2021-2036
9. Global Physical AI Market Analysis and Forecasting ($US Bn), by End-use Industry, 2021-2036
10. Global Physical AI Market Analysis and Forecasting ($US Bn), by Region, 2021-2036
11. North America Physical AI Market Analysis and Forecasting ($US Bn), by Component, 2021-2036
12. North America Physical AI Market Analysis and Forecasting ($US Bn), by Technology, 2021-2036
13. North America Physical AI Market Analysis and Forecasting ($US Bn), by Robot Type, 2021-2036
14. North America Physical AI Market Analysis and Forecasting ($US Bn), by End-use Industry, 2021-2036
15. U.S. Physical AI Market Analysis and Forecasting ($US Bn), by Component, 2021-2036
16. U.S. Physical AI Market Analysis and Forecasting ($US Bn), by Technology, 2021-2036
17. U.S. Physical AI Market Analysis and Forecasting ($US Bn), by Robot Type, 2021-2036
18. U.S. Physical AI Market Analysis and Forecasting ($US Bn), by End-use Industry, 2021-2036
19. Canada Physical AI Market Analysis and Forecasting ($US Bn), by Component, 2021-2036
20. Canada Physical AI Market Analysis and Forecasting ($US Bn), by Technology, 2021-2036
21. Canada Physical AI Market Analysis and Forecasting ($US Bn), by Robot Type, 2021-2036
22. Canada Physical AI Market Analysis and Forecasting ($US Bn), by End-use Industry, 2021-2036
23. Europe Physical AI Market Analysis and Forecasting ($US Bn), by Component, 2021-2036
24. Europe Physical AI Market Analysis and Forecasting ($US Bn), by Technology, 2021-2036
25. Europe Physical AI Market Analysis and Forecasting ($US Bn), by Robot Type, 2021-2036
26. Europe Physical AI Market Analysis and Forecasting ($US Bn), by End-use Industry, 2021-2036
27. Germany Physical AI Market Analysis and Forecasting ($US Bn), by Component, 2021-2036
28. Germany Physical AI Market Analysis and Forecasting ($US Bn), by Technology, 2021-2036
29. Germany Physical AI Market Analysis and Forecasting ($US Bn), by Robot Type, 2021-2036
30. Germany Physical AI Market Analysis and Forecasting ($US Bn), by End-use Industry, 2021-2036
31. U.K. Physical AI Market Analysis and Forecasting ($US Bn), by Component, 2021-2036
32. U.K. Physical AI Market Analysis and Forecasting ($US Bn), by Technology, 2021-2036
33. U.K. Physical AI Market Analysis and Forecasting ($US Bn), by Robot Type, 2021-2036
34. U.K. Physical AI Market Analysis and Forecasting ($US Bn), by End-use Industry, 2021-2036
35. France Physical AI Market Analysis and Forecasting ($US Bn), by Component, 2021-2036
36. France Physical AI Market Analysis and Forecasting ($US Bn), by Technology, 2021-2036
37. France Physical AI Market Analysis and Forecasting ($US Bn), by Robot Type, 2021-2036
38. France Physical AI Market Analysis and Forecasting ($US Bn), by End-use Industry, 2021-2036
39. Italy Physical AI Market Analysis and Forecasting ($US Bn), by Component, 2021-2036
40. Italy Physical AI Market Analysis and Forecasting ($US Bn), by Technology, 2021-2036
41. Italy Physical AI Market Analysis and Forecasting ($US Bn), by Robot Type, 2021-2036
42. Italy Physical AI Market Analysis and Forecasting ($US Bn), by End-use Industry, 2021-2036
43. Spain Physical AI Market Analysis and Forecasting ($US Bn), by Component, 2021-2036
44. Spain Physical AI Market Analysis and Forecasting ($US Bn), by Technology, 2021-2036
45. Spain Physical AI Market Analysis and Forecasting ($US Bn), by Robot Type, 2021-2036
46. Spain Physical AI Market Analysis and Forecasting ($US Bn), by End-use Industry, 2021-2036
47. Russia & CIS Physical AI Market Analysis and Forecasting ($US Bn), by Component, 2021-2036
48. Russia & CIS Physical AI Market Analysis and Forecasting ($US Bn), by Technology, 2021-2036
49. Russia & CIS Physical AI Market Analysis and Forecasting ($US Bn), by Robot Type, 2021-2036
50. Russia & CIS Physical AI Market Analysis and Forecasting ($US Bn), by End-use Industry, 2021-2036
51. Rest of Europe Physical AI Market Analysis and Forecasting ($US Bn), by Component, 2021-2036
52. Rest of Europe Physical AI Market Analysis and Forecasting ($US Bn), by Technology, 2021-2036
53. Rest of Europe Physical AI Market Analysis and Forecasting ($US Bn), by Robot Type, 2021-2036
54. Rest of Europe Physical AI Market Analysis and Forecasting ($US Bn), by End-use Industry, 2021-2036
55. Asia Pacific Physical AI Market Analysis and Forecasting ($US Bn), by Component, 2021-2036
56. Asia Pacific Physical AI Market Analysis and Forecasting ($US Bn), by Technology, 2021-2036
57. Asia Pacific Physical AI Market Analysis and Forecasting ($US Bn), by Robot Type, 2021-2036
58. Asia Pacific Physical AI Market Analysis and Forecasting ($US Bn), by End-use Industry, 2021-2036
59. China Physical AI Market Analysis and Forecasting ($US Bn), by Component, 2021-2036
60. China Physical AI Market Analysis and Forecasting ($US Bn), by Technology, 2021-2036
61. China Physical AI Market Analysis and Forecasting ($US Bn), by Robot Type, 2021-2036
62. China Physical AI Market Analysis and Forecasting ($US Bn), by End-use Industry, 2021-2036
63. India Physical AI Market Analysis and Forecasting ($US Bn), by Component, 2021-2036
64. India Physical AI Market Analysis and Forecasting ($US Bn), by Technology, 2021-2036
65. India Physical AI Market Analysis and Forecasting ($US Bn), by Robot Type, 2021-2036
66. India Physical AI Market Analysis and Forecasting ($US Bn), by End-use Industry, 2021-2036
67. Japan Physical AI Market Analysis and Forecasting ($US Bn), by Component, 2021-2036
68. Japan Physical AI Market Analysis and Forecasting ($US Bn), by Technology, 2021-2036
69. Japan Physical AI Market Analysis and Forecasting ($US Bn), by Robot Type, 2021-2036
70. Japan Physical AI Market Analysis and Forecasting ($US Bn), by End-use Industry, 2021-2036
71. South Korea Physical AI Market Analysis and Forecasting ($US Bn), by Component, 2021-2036
72. South Korea Physical AI Market Analysis and Forecasting ($US Bn), by Technology, 2021-2036
73. South Korea Physical AI Market Analysis and Forecasting ($US Bn), by Robot Type, 2021-2036
74. South Korea Physical AI Market Analysis and Forecasting ($US Bn), by End-use Industry, 2021-2036
75. Taiwan Physical AI Market Analysis and Forecasting ($US Bn), by Component, 2021-2036
76. Taiwan Physical AI Market Analysis and Forecasting ($US Bn), by Technology, 2021-2036
77. Taiwan Physical AI Market Analysis and Forecasting ($US Bn), by Robot Type, 2021-2036
78. Taiwan Physical AI Market Analysis and Forecasting ($US Bn), by End-use Industry, 2021-2036
79. Australia Physical AI Market Analysis and Forecasting ($US Bn), by Component, 2021-2036
80. Australia Physical AI Market Analysis and Forecasting ($US Bn), by Technology, 2021-2036
81. Australia Physical AI Market Analysis and Forecasting ($US Bn), by Robot Type, 2021-2036
82. Australia Physical AI Market Analysis and Forecasting ($US Bn), by End-use Industry, 2021-2036
83. ASEAN Physical AI Market Analysis and Forecasting ($US Bn), by Component, 2021-2036
84. ASEAN Physical AI Market Analysis and Forecasting ($US Bn), by Technology, 2021-2036
85. ASEAN Physical AI Market Analysis and Forecasting ($US Bn), by Robot Type, 2021-2036
86. ASEAN Physical AI Market Analysis and Forecasting ($US Bn), by End-use Industry, 2021-2036
87. Rest of Asia Pacific Physical AI Market Analysis and Forecasting ($US Bn), by Component, 2021-2036
88. Rest of Asia Pacific Physical AI Market Analysis and Forecasting ($US Bn), by Technology, 2021-2036
89. Rest of Asia Pacific Physical AI Market Analysis and Forecasting ($US Bn), by Robot Type, 2021-2036
90. Rest of Asia Pacific Physical AI Market Analysis and Forecasting ($US Bn), by End-use Industry, 2021-2036
91. Latin America Physical AI Market Analysis and Forecasting ($US Bn), by Component, 2021-2036
92. Latin America Physical AI Market Analysis and Forecasting ($US Bn), by Technology, 2021-2036
93. Latin America Physical AI Market Analysis and Forecasting ($US Bn), by Robot Type, 2021-2036
94. Latin America Physical AI Market Analysis and Forecasting ($US Bn), by End-use Industry, 2021-2036
95. Brazil Physical AI Market Analysis and Forecasting ($US Bn), by Component, 2021-2036
96. Brazil Physical AI Market Analysis and Forecasting ($US Bn), by Technology, 2021-2036
97. Brazil Physical AI Market Analysis and Forecasting ($US Bn), by Robot Type, 2021-2036
98. Brazil Physical AI Market Analysis and Forecasting ($US Bn), by End-use Industry, 2021-2036
99. Mexico Physical AI Market Analysis and Forecasting ($US Bn), by Component, 2021-2036
100. Mexico Physical AI Market Analysis and Forecasting ($US Bn), by Technology, 2021-2036
101. Mexico Physical AI Market Analysis and Forecasting ($US Bn), by Robot Type, 2021-2036
102. Mexico Physical AI Market Analysis and Forecasting ($US Bn), by End-use Industry, 2021-2036
103. Argentina Physical AI Market Analysis and Forecasting ($US Bn), by Component, 2021-2036
104. Argentina Physical AI Market Analysis and Forecasting ($US Bn), by Technology, 2021-2036
105. Argentina Physical AI Market Analysis and Forecasting ($US Bn), by Robot Type, 2021-2036
106. Argentina Physical AI Market Analysis and Forecasting ($US Bn), by End-use Industry, 2021-2036
107. Rest of Latin America Physical AI Market Analysis and Forecasting ($US Bn), by Component, 2021-2036
108. Rest of Latin America Physical AI Market Analysis and Forecasting ($US Bn), by Technology, 2021-2036
109. Rest of Latin America Physical AI Market Analysis and Forecasting ($US Bn), by Robot Type, 2021-2036
110. Rest of Latin America Physical AI Market Analysis and Forecasting ($US Bn), by End-use Industry, 2021-2036
111. Middle East & Africa Physical AI Market Analysis and Forecasting ($US Bn), by Component, 2021-2036
112. Middle East & Africa Physical AI Market Analysis and Forecasting ($US Bn), by Technology, 2021-2036
113. Middle East & Africa Physical AI Market Analysis and Forecasting ($US Bn), by Robot Type, 2021-2036
114. Middle East & Africa Physical AI Market Analysis and Forecasting ($US Bn), by End-use Industry, 2021-2036
115. Saudi Arabia Physical AI Market Analysis and Forecasting ($US Bn), by Component, 2021-2036
116. Saudi Arabia Physical AI Market Analysis and Forecasting ($US Bn), by Technology, 2021-2036
117. Saudi Arabia Physical AI Market Analysis and Forecasting ($US Bn), by Robot Type, 2021-2036
118. Saudi Arabia Physical AI Market Analysis and Forecasting ($US Bn), by End-use Industry, 2021-2036
119. UAE Physical AI Market Analysis and Forecasting ($US Bn), by Component, 2021-2036
120. UAE Physical AI Market Analysis and Forecasting ($US Bn), by Technology, 2021-2036
121. UAE Physical AI Market Analysis and Forecasting ($US Bn), by Robot Type, 2021-2036
122. UAE Physical AI Market Analysis and Forecasting ($US Bn), by End-use Industry, 2021-2036
123. South Africa Physical AI Market Analysis and Forecasting ($US Bn), by Component, 2021-2036
124. South Africa Physical AI Market Analysis and Forecasting ($US Bn), by Technology, 2021-2036
125. South Africa Physical AI Market Analysis and Forecasting ($US Bn), by Robot Type, 2021-2036
126. South Africa Physical AI Market Analysis and Forecasting ($US Bn), by End-use Industry, 2021-2036
127. Rest of Middle East & Africa Physical AI Market Analysis and Forecasting ($US Bn), by Component, 2021-2036
128. Rest of Middle East & Africa Physical AI Market Analysis and Forecasting ($US Bn), by Technology, 2021-2036
129. Rest of Middle East & Africa Physical AI Market Analysis and Forecasting ($US Bn), by Robot Type, 2021-2036
130. Rest of Middle East & Africa Physical AI Market Analysis and Forecasting ($US Bn), by End-use Industry, 2021-2036
131. Competition Landscape
131.1. Market Share Analysis (%), by Company, 2025
131.2. Competitive Benchmarking
131.3. Company Profiles
131.3.1. NVIDIA Corporation
131.3.1.1. Company Overview
131.3.1.2. Business Portfolio
131.3.1.3. Financials
131.3.1.4. Geographical Footprint
131.3.1.5. SWOT Analysis
131.3.1.6. Recent Developments and Strategies
131.3.2. Tesla, Boston Dynamics
131.3.2.1. Company Overview
131.3.2.2. Business Portfolio
131.3.2.3. Financials
131.3.2.4. Geographical Footprint
131.3.2.5. SWOT Analysis
131.3.2.6. Recent Developments and Strategies
131.3.3. Figure AI
131.3.3.1. Company Overview
131.3.3.2. Business Portfolio
131.3.3.3. Financials
131.3.3.4. Geographical Footprint
131.3.3.5. SWOT Analysis
131.3.3.6. Recent Developments and Strategies
131.3.4. Agility Robotics
131.3.4.1. Company Overview
131.3.4.2. Business Portfolio
131.3.4.3. Financials
131.3.4.4. Geographical Footprint
131.3.4.5. SWOT Analysis
131.3.4.6. Recent Developments and Strategies
131.3.5. ABB Ltd.
131.3.5.1. Company Overview
131.3.5.2. Business Portfolio
131.3.5.3. Financials
131.3.5.4. Geographical Footprint
131.3.5.5. SWOT Analysis
131.3.5.6. Recent Developments and Strategies
131.3.6. FANUC Corporation
131.3.6.1. Company Overview
131.3.6.2. Business Portfolio
131.3.6.3. Financials
131.3.6.4. Geographical Footprint
131.3.6.5. SWOT Analysis
131.3.6.6. Recent Developments and Strategies
131.3.7. Kuka AG
131.3.7.1. Company Overview
131.3.7.2. Business Portfolio
131.3.7.3. Financials
131.3.7.4. Geographical Footprint
131.3.7.5. SWOT Analysis
131.3.7.6. Recent Developments and Strategies
131.3.8. Siemens
131.3.8.1. Company Overview
131.3.8.2. Business Portfolio
131.3.8.3. Financials
131.3.8.4. Geographical Footprint
131.3.8.5. SWOT Analysis
131.3.8.6. Recent Developments and Strategies
131.3.9. SoftBank Robotics Group
131.3.9.1. Company Overview
131.3.9.2. Business Portfolio
131.3.9.3. Financials
131.3.9.4. Geographical Footprint
131.3.9.5. SWOT Analysis
131.3.9.6. Recent Developments and Strategies
131.3.10. Toyota Motor Corporation
131.3.10.1. Company Overview
131.3.10.2. Business Portfolio
131.3.10.3. Financials
131.3.10.4. Geographical Footprint
131.3.10.5. SWOT Analysis
131.3.10.6. Recent Developments and Strategies
131.3.11. Google DeepMind
131.3.11.1. Company Overview
131.3.11.2. Business Portfolio
131.3.11.3. Financials
131.3.11.4. Geographical Footprint
131.3.11.5. SWOT Analysis
131.3.11.6. Recent Developments and Strategies
131.3.12. Hyundai Motor Group
131.3.12.1. Company Overview
131.3.12.2. Business Portfolio
131.3.12.3. Financials
131.3.12.4. Geographical Footprint
131.3.12.5. SWOT Analysis
131.3.12.6. Recent Developments and Strategies
131.3.13. Amazon
131.3.13.1. Company Overview
131.3.13.2. Business Portfolio
131.3.13.3. Financials
131.3.13.4. Geographical Footprint
131.3.13.5. SWOT Analysis
131.3.13.6. Recent Developments and Strategies
131.3.14. Unitree Robotics
131.3.14.1. Company Overview
131.3.14.2. Business Portfolio
131.3.14.3. Financials
131.3.14.4. Geographical Footprint
131.3.14.5. SWOT Analysis
131.3.14.6. Recent Developments and Strategies
131.3.15. Others
132. Appendix

- Get Started -
Get insights that lead to new growth opportunities
- Talk to Experts -
Get answers to your queries on this report from our experts
Frequently Asked Questions
The global Physical AI market in 2025 was $US 5.3 Billion.
The global Physical AI market will be $US 117 Billion by 2036.
The expected growth rate (CAGR%) of the global Physical AI market is 22.4% for the period 2026-2036.
Convergence of Foundation Models and Robotics Enabling General-Purpose Automation and Surging Capital Investment and Labor Shortage Pressure Across Manufacturing and Logistics.
Computer Vision was the largest segment in technology with around 40% share among all in Physical AI Market in 2025.
North America was the leading regions for Physical AI holding 40% of the global market in 2025.
NVIDIA Corporation, Tesla, Boston Dynamics, Figure AI, Agility Robotics, ABB Ltd., FANUC Corporation, Kuka AG, Siemens, SoftBank Robotics Group, Toyota Motor Corporation, Google DeepMind, Hyundai Motor Group, Amazon, Unitree Robotics and Others.