Global Lab-as-a-Service Market
Lab-as-a-Service Market (Service Type: Testing Services, Research Services, Infrastructure Services, Digital Services and Others; Lab Type: Wet Labs, Dry Labs and Hybrid Labs; Technology: Traditional Shared Labs, Digitally Connected Labs and Autonomous Labs; Deployment Type: On-demand, Subscription-based and Others; Application: Drug Discovery, Biotechnology Research, Chemical & Materials Research, Food & Beverage Testing, Environmental Analysis, Electronics & Semiconductor Research and Academic & Institutional Research; End-user: Startups, Small & Mid-sized Enterprises, Large Enterprises, Academic Institutions, Government Research Organizations and Others) – Global Industry Analysis, Shares, Growth, Trends and Forecast 2021-2036
| Format: PDF/PPT/Excel
| Product ID:
4593
| Report Version:
June 2026
- Report Preview
- Table of Content
- Request Customization
Market Snappshot
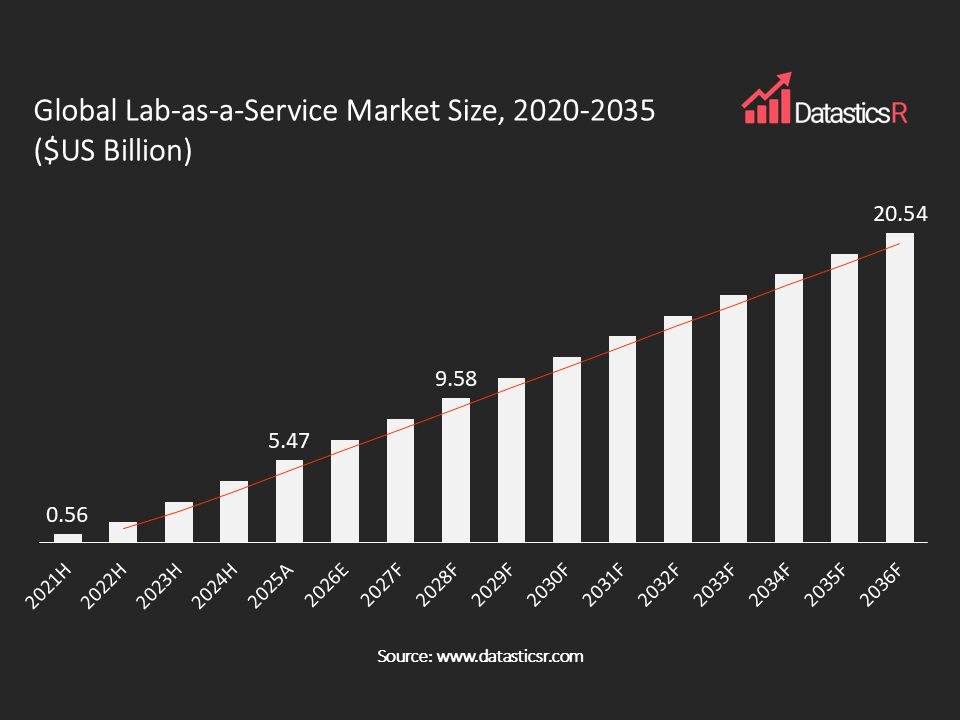
- Market Size in 2025: $US 5.47 Bn
- Forecast Market by 2036: $US 20.54 Bn
- CAGR for the Period 2026-2036: 11.6%
- Top Region in Terms of Market Share: North America (38.5%)
- Key Players: Emerald Cloud Lab, Strateos, Arctoris, Culture Biosciences, Benchling, BioLabs, LabCentral, MBC BioLabs, SGS, Intertek, and Others
Analyst Viewpoint:
The Lab-as-a-Service Market is shifting lab infrastructure from a capital-heavy ownership economy to an on-demand, cloud-like economy. Driven by a need among biotechnology start-ups, pharmaceutical R&D teams, advanced material producers, and semiconductor manufacturers to harness elite laboratory equipment and capabilities without burdensome upfront expenses, Cloud-Based Laboratory Services, robotic experiment platforms and AI-Powered Laboratory Services are offering researchers unprecedented velocity in designing, conducting and analyzing experiments remotely. At the enterprise level, Laboratory as a Service Solutions minimize costly facilities spend, compress timelines and democratize advanced tooling while barriers to entry are faced through the challenges of data security and privacy concerns, R&D workflow integration, regulatory issues and limited ability to fully automate highly bespoke experiments. In the future, the Lab-as-a-Service market is expected to advance beyond simple remote access to R&D-as-a-Service in the form of R&D ecosystems comprised of not only laboratory infrastructure but also robotics automation, digital twins and Connected Laboratory Platforms augmented with real-time analysis. A few of the major Lab-as-a-Service Market Trends and Opportunities the industry can capitalize on within drug discovery, synthetic biology, battery materials and semiconductor process R&D.
Lab-as-a-Service Market Overview:
Lab-as-a-Service (LaaS) is a novel service-based model that allows organizations to lease or subscribe to laboratory infrastructure, equipment, testing services, research services and digital experimentation platforms. LaaS offers a flexible and efficient way for companies to get access to state-of-the-art research and testing capabilities and equipment without the need for the upfront investment associated with managing a physical laboratory and its upkeep. Market includes Testing services, research services, Laboratory infrastructure, digital lab and Scientific services. It can be used in Drug Discovery Lab-as-a-Service, Biotechnology Research Lab-as-a-Service, chemicals and materials Lab-as-a-Service, Food & Beverages, environmental services Lab-as-a-Service, electronics & semiconductors Lab-as-a-Service and research by academic institutions. LaaS Market is projected to hit US$ 20.54 billion in 2036, experiencing a growing compound annual growth rate of 11.6% as reported in DatasticsR research study. Industry’s Technological evolution trend is moving away from a fully owned and on-premise laboratory toward increasingly integrated and autonomous digital experimentation labs. A digital LaaS platform has come up leveraging cloud services, LIMS solutions, IoT enabled research instrumentation and machine learning solutions for a unified approach that provides efficient data management, collaboration and remote laboratory services. With innovative Lab-as-a-Service solutions such as wet labs, dry labs, a start-up’s need to scale their business is fulfilled with access to laboratory resources and experimentation expertise. As cloud solutions continue to proliferate with advances in artificial intelligence and IoT, research work will be accelerated and the lab infrastructure market will be transformed.
| Drivers | Rising Demand for Cost-Efficient and Scalable R&D Infrastructure |
| Growth of Laboratory Automation, Cloud Labs, And AI-Enabled Experimentation |
Rising Demand for Cost-Efficient and Scalable R&D Infrastructure
Rising costs associated with purchasing new laboratory equipment, maintaining laboratory facilities, and the difficulty finding sufficient qualified scientific personnel is driving research-intensive industries to seek out alternatives to traditional laboratory ownership models. A cutting-edge biotechnology, materials science, or semiconductor laboratory typically requires an investment of millions to tens of millions of dollars for equipment, construction, and operation, hindering new start-ups and innovative businesses. Annual global spending on R&D research expenditures topped US $3.1 trillion in 2025, showing increasing reliance on cost-effective and efficient research infrastructure. Lab-as-a-Service providers are bringing such modern laboratory and scientific equipment to market in a flexible and cost effective way. The biotechnology segment of the Lab-as-a-Service market is perhaps the most pronounced case for lab renting. Estimates from industry associations show that thousands of venture-funded biotech start-ups in the U.S., China, Europe and India require access to sophisticated technologies, including next-generation sequencing (NGS), high-throughput screening (HTS), high-performance imaging, and mass spectrometry, that enable accelerated product and pipeline development. This in turn leads to demand for Laboratory Rental Services for Startups around the globe, especially as governments continue to invest in research-based incentives and firms feel pressure to get new drugs or products to market sooner. Hence, growing pressure on pharmaceutical, biotechnology, and materials firms to decrease development times will drive adoption of Outsourced Research Laboratory Services and make Infrastructure Services and On-demand deployment models among the largest growing segments.
Growth of Laboratory Automation, Cloud Labs, And AI-Enabled Experimentation
Research workflows are rapidly undergoing an overhaul driven by technological convergence, the confluence of robotics, cloud computing, AI, and laboratory automation systems. In 2024, 542,000+ new industrial robots globally installed, as organizations embrace automation in both manufacturing and scientific settings. Cloud-based lab providers are helping scientists execute remotely-based workflows by providing a digital platform that permits them to design an experiment, schedule instrument usage, collect data and run a sophisticated analysis, all while virtually on the move. When applied to automated scientific workflows and experiments, it yields high level accuracy, a reduced propensity for errors, decreased workflow lead-times, and an acceleration of new discoveries, assisted by AI-driven predictive modeling algorithms. Drug discovery is among the primary beneficiaries of this transformation. According to industry estimates, it requires a minimum of over 10 years to discover a new pharmaceutical and over US $2 billion for it, thereby creating massive interest to develop innovative autonomous research models. Thousands of conditions of experiment can be performed at one time on an advance screening platform, which cuts down on development time and it is stimulating development in the Autonomous Laboratory Services Market, particularly in pharmaceutical and biotechnology sectors, alongside of it, Smart Laboratory Service platforms that connect to multiple instruments, software and their data management system are fueling innovation. As a result of growing interest in Digitalized Connected Labs and Autonomous Labs, researchers and organizations should expect significant gains in productivity, collaboration, faster and scientific insights that continue to fuel and support market expansion for years to come.
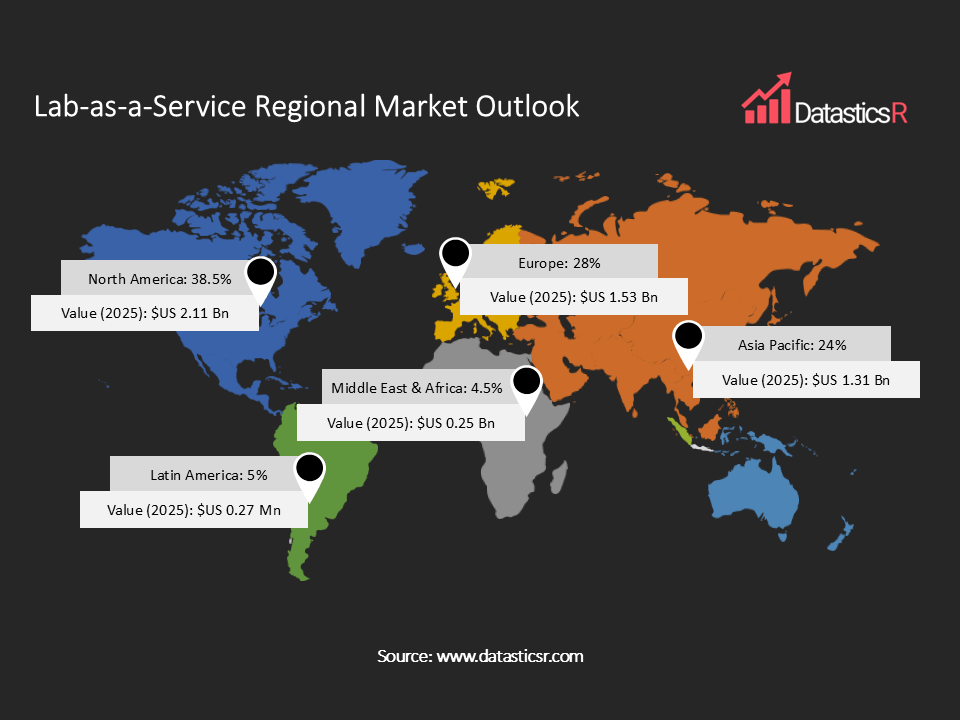
Lab-as-a-Service Regional Market Outlook:
North America leads with a share of 38.5% in the global market with High concentration of well-developed biotechnology ecosystems, substantial availability of venture capital financing, higher adoption rate of advanced laboratory automation and presence of major cloud laboratory players contribute significantly to market dominance in the region. United States remained as one of the largest markets due to increased expenditure in pharmaceutical & biotechnology research & development. Europe captured a market share of approximately 28% on basis of revenue generated. Well established academic & research institutions, government driven research & development innovation policies, prominent biotech hubs in Germany, United Kingdom, France & Netherlands and growing laboratory digitalization projects were key growth drivers. Adoption of subscription-based laboratory service models were growing among research facilities who preferred the option for consistent, extended use of cutting-edge equipment. The Asia Pacific region represented approximately 24% of global market share for on demand laboratory service. The region was the fastest growing market. High level investment in biotechnology, Semiconductor research, laboratory automation and in increasing entrepreneurial startups supported the region demand for Flexible Laboratory models of access. The Latin America region generated revenue of about 5.0% of overall market share, led by its developing economies namely Brazil & Mexico that have escalating pharmaceutical and environmental testing activities. Middle East & Africa registered a market share of approximately 4.5% owing to higher investments by various researchers towards the development of UAE, Saudi Arabia, and South Africa across diverse biotechnology, environment monitoring and healthcare sector.
Key Companies in Lab-as-a-Service Market:
The Lab-as-a-Service Market Size and Forecast revealed a competitive scene which is still moderately scattered among players including cloud lab professionals, automation specialist labs, lab sharing specialists, testing & research providers. Some larger ones are fighting based on their automation functions, cloud services, expanding global foothold, and a thorough R&D providing suite. Newer companies concentrate on cloud laboratory services, remote experimentation tools, and an AI framework to develop operations. Partnering with drug producers, budding biotech, and colleges has actually become necessary. Competitive advantages consist of a facility for data integration, the degree of advancement in automated functions, their proficiency in managing laws and regulations, and state-of-the-art associated lab systems for a complete research study. Leading players consist of Emerald Cloud Lab, Strateos, Arctoris, Culture Biosciences, Benchling, BioLabs, LabCentral, MBC BioLabs, SGS, Intertek, Eurofins Scientific, Charles River Laboratories, Labcorp, Thermo Fisher Scientific, Agilent Technologies, and others.
Key Developments in Lab-as-a-Service Market:
| 1. MGI Tech Unveils New Laboratory Automation and Proteomics Solutions: In June 2026, MGI Tech Co Ltd presented its latest developments in laboratory automation and integrated workflow solutions at the Society for Laboratory Automation and Screening (SLAS) 2026 event in Vienna, Austria. The portfolio includes systems designed to assist with research efficiency and simplify workflows in proteomics and clinical laboratory automation. |
| 2. E2E Networks Launches ‘AI Lab as a Service’ for Universities: In January 2025, E2E Networks, launched AI Lab as a Service (AILaaS), a ready solution for every Indian college and university, which removes the shackles of having to build on-prem AI lab and maintaining it. With AILaaS, educational institutions can use sophisticated AI tools and tools without the need for paying to own them, but instead use a PAYG model. |
Lab-as-a-Service Market Attributes:
| ATTRIBUTE | DETAILS |
| Market Value, 2025 | $US 5.47 Billion |
| Forecasted Market Value, 2036 | $US 20.54 Billion |
| CAGR (2026-2036) | 11.6% |
| Analysis Period | 2021-2036 |
| Historic Period | 2021-2024 |
| Base Year | 2025 |
| Forecast Period | 2026-2036 |
| Volume Unit | NA |
| Value Unit | $US Billion |
| Market Segmentation | By Service Type
By Lab Type
By Technology:
By Deployment Type
By Application
By End-user
By Region
|
| Companies Profiles |
|
| Customization Request | Available upon request |
1. Introduction
1.1. Report Scope
1.2. Market Segmentations and Definitions
1.3. Geographical Coverage
2. Executive Summary
2.1. Key Facts and Figures
2.2. Trends Impacting the Market
2.3. DatasticsR Growth Opportunity Matrix
3. Market Overview
3.1. Global Lab-as-a-Service Market Analysis and Forecast, 2021-2036
3.1.1. Global Lab-as-a-Service Market Size ($US Bn)
3.2. Supply-side and Demand-side Trends
3.3. Technology Roadmap and Developments
3.4. Market Dynamics
3.4.1. Drivers
3.4.2. Restraints
3.4.3. Opportunities
3.5. Porter’s Five Forces Analysis
3.6. PESTL Analysis
3.7. Industry SWOT Analysis
3.8. Regulatory Landscape
3.9. Value Chain Analysis
3.9.1. List of Equipment/Instrument Manufacturers
3.9.2. List of Infrastructure Providers
3.9.3. List of Digital Platforms/Software Providers
3.9.4. List of Lab-as-a-Service Providers
3.9.5. List of Potential Customers
3.10. Impact of Current Geopolitical Scenario on the Market
4. Technical Analysis
4.1. Technical Specification Analysis
4.2. Details of Lab Process
4.3. Technology Adoption and Emerging Technologies
4.4. R&D Trends and Patents Landscape
4.5. Cost Structure and Profitability Analysis
5. Global Lab-as-a-Service Market Analysis and Forecasting ($US Bn), by Service Type, 2021-2036
6. Global Lab-as-a-Service Market Analysis and Forecasting ($US Bn), by Lab Type, 2021-2036
7. Global Lab-as-a-Service Market Analysis and Forecasting ($US Bn), by Technology, 2021-2036
8. Global Lab-as-a-Service Market Analysis and Forecasting ($US Bn), by Deployment Type, 2021-2036
9. Global Lab-as-a-Service Market Analysis and Forecasting ($US Bn), by Application, 2021-2036
10. Global Lab-as-a-Service Market Analysis and Forecasting ($US Bn), by End-user, 2021-2036
11. Global Lab-as-a-Service Market Analysis and Forecasting ($US Bn), by Region, 2021-2036
12. North America Lab-as-a-Service Market Analysis and Forecasting ($US Bn), by Service Type, 2021-2036
13. North America Lab-as-a-Service Market Analysis and Forecasting ($US Bn), by Lab Type, 2021-2036
14. North America Lab-as-a-Service Market Analysis and Forecasting ($US Bn), by Technology, 2021-2036
15. North America Lab-as-a-Service Market Analysis and Forecasting ($US Bn), by Deployment Type, 2021-2036
16. North America Lab-as-a-Service Market Analysis and Forecasting ($US Bn), by Application, 2021-2036
17. North America Lab-as-a-Service Market Analysis and Forecasting ($US Bn), by End-user, 2021-2036
18. U.S. Lab-as-a-Service Market Analysis and Forecasting ($US Bn), by Service Type, 2021-2036
19. U.S. Lab-as-a-Service Market Analysis and Forecasting ($US Bn), by Lab Type, 2021-2036
20. U.S. Lab-as-a-Service Market Analysis and Forecasting ($US Bn), by Technology, 2021-2036
21. U.S. Lab-as-a-Service Market Analysis and Forecasting ($US Bn), by Deployment Type, 2021-2036
22. U.S. Lab-as-a-Service Market Analysis and Forecasting ($US Bn), by Application, 2021-2036
23. U.S. Lab-as-a-Service Market Analysis and Forecasting ($US Bn), by End-user, 2021-2036
24. Canada Lab-as-a-Service Market Analysis and Forecasting ($US Bn), by Service Type, 2021-2036
25. Canada Lab-as-a-Service Market Analysis and Forecasting ($US Bn), by Lab Type, 2021-2036
26. Canada Lab-as-a-Service Market Analysis and Forecasting ($US Bn), by Technology, 2021-2036
27. Canada Lab-as-a-Service Market Analysis and Forecasting ($US Bn), by Deployment Type, 2021-2036
28. Canada Lab-as-a-Service Market Analysis and Forecasting ($US Bn), by Application, 2021-2036
29. Canada Lab-as-a-Service Market Analysis and Forecasting ($US Bn), by End-user, 2021-2036
30. Europe Lab-as-a-Service Market Analysis and Forecasting ($US Bn), by Service Type, 2021-2036
31. Europe Lab-as-a-Service Market Analysis and Forecasting ($US Bn), by Lab Type, 2021-2036
32. Europe Lab-as-a-Service Market Analysis and Forecasting ($US Bn), by Technology, 2021-2036
33. Europe Lab-as-a-Service Market Analysis and Forecasting ($US Bn), by Deployment Type, 2021-2036
34. Europe Lab-as-a-Service Market Analysis and Forecasting ($US Bn), by Application, 2021-2036
35. Europe Lab-as-a-Service Market Analysis and Forecasting ($US Bn), by End-user, 2021-2036
36. Germany Lab-as-a-Service Market Analysis and Forecasting ($US Bn), by Service Type, 2021-2036
37. Germany Lab-as-a-Service Market Analysis and Forecasting ($US Bn), by Lab Type, 2021-2036
38. Germany Lab-as-a-Service Market Analysis and Forecasting ($US Bn), by Technology, 2021-2036
39. Germany Lab-as-a-Service Market Analysis and Forecasting ($US Bn), by Deployment Type, 2021-2036
40. Germany Lab-as-a-Service Market Analysis and Forecasting ($US Bn), by Application, 2021-2036
41. Germany Lab-as-a-Service Market Analysis and Forecasting ($US Bn), by End-user, 2021-2036
42. U.K. Lab-as-a-Service Market Analysis and Forecasting ($US Bn), by Service Type, 2021-2036
43. U.K. Lab-as-a-Service Market Analysis and Forecasting ($US Bn), by Lab Type, 2021-2036
44. U.K. Lab-as-a-Service Market Analysis and Forecasting ($US Bn), by Technology, 2021-2036
45. U.K. Lab-as-a-Service Market Analysis and Forecasting ($US Bn), by Deployment Type, 2021-2036
46. U.K. Lab-as-a-Service Market Analysis and Forecasting ($US Bn), by Application, 2021-2036
47. U.K. Lab-as-a-Service Market Analysis and Forecasting ($US Bn), by End-user, 2021-2036
48. France Lab-as-a-Service Market Analysis and Forecasting ($US Bn), by Service Type, 2021-2036
49. France Lab-as-a-Service Market Analysis and Forecasting ($US Bn), by Lab Type, 2021-2036
50. France Lab-as-a-Service Market Analysis and Forecasting ($US Bn), by Technology, 2021-2036
51. France Lab-as-a-Service Market Analysis and Forecasting ($US Bn), by Deployment Type, 2021-2036
52. France Lab-as-a-Service Market Analysis and Forecasting ($US Bn), by Application, 2021-2036
53. France Lab-as-a-Service Market Analysis and Forecasting ($US Bn), by End-user, 2021-2036
54. Italy Lab-as-a-Service Market Analysis and Forecasting ($US Bn), by Service Type, 2021-2036
55. Italy Lab-as-a-Service Market Analysis and Forecasting ($US Bn), by Lab Type, 2021-2036
56. Italy Lab-as-a-Service Market Analysis and Forecasting ($US Bn), by Technology, 2021-2036
57. Italy Lab-as-a-Service Market Analysis and Forecasting ($US Bn), by Deployment Type, 2021-2036
58. Italy Lab-as-a-Service Market Analysis and Forecasting ($US Bn), by Application, 2021-2036
59. Italy Lab-as-a-Service Market Analysis and Forecasting ($US Bn), by End-user, 2021-2036
60. Spain Lab-as-a-Service Market Analysis and Forecasting ($US Bn), by Service Type, 2021-2036
61. Spain Lab-as-a-Service Market Analysis and Forecasting ($US Bn), by Lab Type, 2021-2036
62. Spain Lab-as-a-Service Market Analysis and Forecasting ($US Bn), by Technology, 2021-2036
63. Spain Lab-as-a-Service Market Analysis and Forecasting ($US Bn), by Deployment Type, 2021-2036
64. Spain Lab-as-a-Service Market Analysis and Forecasting ($US Bn), by Application, 2021-2036
65. Spain Lab-as-a-Service Market Analysis and Forecasting ($US Bn), by End-user, 2021-2036
66. Russia & CIS Lab-as-a-Service Market Analysis and Forecasting ($US Bn), by Service Type, 2021-2036
67. Russia & CIS Lab-as-a-Service Market Analysis and Forecasting ($US Bn), by Lab Type, 2021-2036
68. Russia & CIS Lab-as-a-Service Market Analysis and Forecasting ($US Bn), by Technology, 2021-2036
69. Russia & CIS Lab-as-a-Service Market Analysis and Forecasting ($US Bn), by Deployment Type, 2021-2036
70. Russia & CIS Lab-as-a-Service Market Analysis and Forecasting ($US Bn), by Application, 2021-2036
71. Russia & CIS Lab-as-a-Service Market Analysis and Forecasting ($US Bn), by End-user, 2021-2036
72. Rest of Europe Lab-as-a-Service Market Analysis and Forecasting ($US Bn), by Service Type, 2021-2036
73. Rest of Europe Lab-as-a-Service Market Analysis and Forecasting ($US Bn), by Lab Type, 2021-2036
74. Rest of Europe Lab-as-a-Service Market Analysis and Forecasting ($US Bn), by Technology, 2021-2036
75. Rest of Europe Lab-as-a-Service Market Analysis and Forecasting ($US Bn), by Deployment Type, 2021-2036
76. Rest of Europe Lab-as-a-Service Market Analysis and Forecasting ($US Bn), by Application, 2021-2036
77. Rest of Europe Lab-as-a-Service Market Analysis and Forecasting ($US Bn), by End-user, 2021-2036
78. Asia Pacific Lab-as-a-Service Market Analysis and Forecasting ($US Bn), by Service Type, 2021-2036
79. Asia Pacific Lab-as-a-Service Market Analysis and Forecasting ($US Bn), by Lab Type, 2021-2036
80. Asia Pacific Lab-as-a-Service Market Analysis and Forecasting ($US Bn), by Technology, 2021-2036
81. Asia Pacific Lab-as-a-Service Market Analysis and Forecasting ($US Bn), by Deployment Type, 2021-2036
82. Asia Pacific Lab-as-a-Service Market Analysis and Forecasting ($US Bn), by Application, 2021-2036
83. Asia Pacific Lab-as-a-Service Market Analysis and Forecasting ($US Bn), by End-user, 2021-2036
84. China Lab-as-a-Service Market Analysis and Forecasting ($US Bn), by Service Type, 2021-2036
85. China Lab-as-a-Service Market Analysis and Forecasting ($US Bn), by Lab Type, 2021-2036
86. China Lab-as-a-Service Market Analysis and Forecasting ($US Bn), by Technology, 2021-2036
87. China Lab-as-a-Service Market Analysis and Forecasting ($US Bn), by Deployment Type, 2021-2036
88. China Lab-as-a-Service Market Analysis and Forecasting ($US Bn), by Application, 2021-2036
89. China Lab-as-a-Service Market Analysis and Forecasting ($US Bn), by End-user, 2021-2036
90. India Lab-as-a-Service Market Analysis and Forecasting ($US Bn), by Service Type, 2021-2036
91. India Lab-as-a-Service Market Analysis and Forecasting ($US Bn), by Lab Type, 2021-2036
92. India Lab-as-a-Service Market Analysis and Forecasting ($US Bn), by Technology, 2021-2036
93. India Lab-as-a-Service Market Analysis and Forecasting ($US Bn), by Deployment Type, 2021-2036
94. India Lab-as-a-Service Market Analysis and Forecasting ($US Bn), by Application, 2021-2036
95. India Lab-as-a-Service Market Analysis and Forecasting ($US Bn), by End-user, 2021-2036
96. Japan Lab-as-a-Service Market Analysis and Forecasting ($US Bn), by Service Type, 2021-2036
97. Japan Lab-as-a-Service Market Analysis and Forecasting ($US Bn), by Lab Type, 2021-2036
98. Japan Lab-as-a-Service Market Analysis and Forecasting ($US Bn), by Technology, 2021-2036
99. Japan Lab-as-a-Service Market Analysis and Forecasting ($US Bn), by Deployment Type, 2021-2036
100. Japan Lab-as-a-Service Market Analysis and Forecasting ($US Bn), by Application, 2021-2036
101. Japan Lab-as-a-Service Market Analysis and Forecasting ($US Bn), by End-user, 2021-2036
102. South Korea Lab-as-a-Service Market Analysis and Forecasting ($US Bn), by Service Type, 2021-2036
103. South Korea Lab-as-a-Service Market Analysis and Forecasting ($US Bn), by Lab Type, 2021-2036
104. South Korea Lab-as-a-Service Market Analysis and Forecasting ($US Bn), by Technology, 2021-2036
105. South Korea Lab-as-a-Service Market Analysis and Forecasting ($US Bn), by Deployment Type, 2021-2036
106. South Korea Lab-as-a-Service Market Analysis and Forecasting ($US Bn), by Application, 2021-2036
107. South Korea Lab-as-a-Service Market Analysis and Forecasting ($US Bn), by End-user, 2021-2036
108. Taiwan Lab-as-a-Service Market Analysis and Forecasting ($US Bn), by Service Type, 2021-2036
109. Taiwan Lab-as-a-Service Market Analysis and Forecasting ($US Bn), by Lab Type, 2021-2036
110. Taiwan Lab-as-a-Service Market Analysis and Forecasting ($US Bn), by Technology, 2021-2036
111. Taiwan Lab-as-a-Service Market Analysis and Forecasting ($US Bn), by Deployment Type, 2021-2036
112. Taiwan Lab-as-a-Service Market Analysis and Forecasting ($US Bn), by Application, 2021-2036
113. Taiwan Lab-as-a-Service Market Analysis and Forecasting ($US Bn), by End-user, 2021-2036
114. Australia Lab-as-a-Service Market Analysis and Forecasting ($US Bn), by Service Type, 2021-2036
115. Australia Lab-as-a-Service Market Analysis and Forecasting ($US Bn), by Lab Type, 2021-2036
116. Australia Lab-as-a-Service Market Analysis and Forecasting ($US Bn), by Technology, 2021-2036
117. Australia Lab-as-a-Service Market Analysis and Forecasting ($US Bn), by Deployment Type, 2021-2036
118. Australia Lab-as-a-Service Market Analysis and Forecasting ($US Bn), by Application, 2021-2036
119. Australia Lab-as-a-Service Market Analysis and Forecasting ($US Bn), by End-user, 2021-2036
120. ASEAN Lab-as-a-Service Market Analysis and Forecasting ($US Bn), by Service Type, 2021-2036
121. ASEAN Lab-as-a-Service Market Analysis and Forecasting ($US Bn), by Lab Type, 2021-2036
122. ASEAN Lab-as-a-Service Market Analysis and Forecasting ($US Bn), by Technology, 2021-2036
123. ASEAN Lab-as-a-Service Market Analysis and Forecasting ($US Bn), by Deployment Type, 2021-2036
124. ASEAN Lab-as-a-Service Market Analysis and Forecasting ($US Bn), by Application, 2021-2036
125. ASEAN Lab-as-a-Service Market Analysis and Forecasting ($US Bn), by End-user, 2021-2036
126. Rest of Asia Pacific Lab-as-a-Service Market Analysis and Forecasting ($US Bn), by Service Type, 2021-2036
127. Rest of Asia Pacific Lab-as-a-Service Market Analysis and Forecasting ($US Bn), by Lab Type, 2021-2036
128. Rest of Asia Pacific Lab-as-a-Service Market Analysis and Forecasting ($US Bn), by Technology, 2021-2036
129. Rest of Asia Pacific Lab-as-a-Service Market Analysis and Forecasting ($US Bn), by Deployment Type, 2021-2036
130. Rest of Asia Pacific Lab-as-a-Service Market Analysis and Forecasting ($US Bn), by Application, 2021-2036
131. Rest of Asia Pacific Lab-as-a-Service Market Analysis and Forecasting ($US Bn), by End-user, 2021-2036
132. Latin America Lab-as-a-Service Market Analysis and Forecasting ($US Bn), by Service Type, 2021-2036
133. Latin America Lab-as-a-Service Market Analysis and Forecasting ($US Bn), by Lab Type, 2021-2036
134. Latin America Lab-as-a-Service Market Analysis and Forecasting ($US Bn), by Technology, 2021-2036
135. Latin America Lab-as-a-Service Market Analysis and Forecasting ($US Bn), by Deployment Type, 2021-2036
136. Latin America Lab-as-a-Service Market Analysis and Forecasting ($US Bn), by Application, 2021-2036
137. Latin America Lab-as-a-Service Market Analysis and Forecasting ($US Bn), by End-user, 2021-2036
138. Brazil Lab-as-a-Service Market Analysis and Forecasting ($US Bn), by Service Type, 2021-2036
139. Brazil Lab-as-a-Service Market Analysis and Forecasting ($US Bn), by Lab Type, 2021-2036
140. Brazil Lab-as-a-Service Market Analysis and Forecasting ($US Bn), by Technology, 2021-2036
141. Brazil Lab-as-a-Service Market Analysis and Forecasting ($US Bn), by Deployment Type, 2021-2036
142. Brazil Lab-as-a-Service Market Analysis and Forecasting ($US Bn), by Application, 2021-2036
143. Brazil Lab-as-a-Service Market Analysis and Forecasting ($US Bn), by End-user, 2021-2036
144. Mexico Lab-as-a-Service Market Analysis and Forecasting ($US Bn), by Service Type, 2021-2036
145. Mexico Lab-as-a-Service Market Analysis and Forecasting ($US Bn), by Lab Type, 2021-2036
146. Mexico Lab-as-a-Service Market Analysis and Forecasting ($US Bn), by Technology, 2021-2036
147. Mexico Lab-as-a-Service Market Analysis and Forecasting ($US Bn), by Deployment Type, 2021-2036
148. Mexico Lab-as-a-Service Market Analysis and Forecasting ($US Bn), by Application, 2021-2036
149. Mexico Lab-as-a-Service Market Analysis and Forecasting ($US Bn), by End-user, 2021-2036
150. Argentina Lab-as-a-Service Market Analysis and Forecasting ($US Bn), by Service Type, 2021-2036
151. Argentina Lab-as-a-Service Market Analysis and Forecasting ($US Bn), by Lab Type, 2021-2036
152. Argentina Lab-as-a-Service Market Analysis and Forecasting ($US Bn), by Technology, 2021-2036
153. Argentina Lab-as-a-Service Market Analysis and Forecasting ($US Bn), by Deployment Type, 2021-2036
154. Argentina Lab-as-a-Service Market Analysis and Forecasting ($US Bn), by Application, 2021-2036
155. Argentina Lab-as-a-Service Market Analysis and Forecasting ($US Bn), by End-user, 2021-2036
156. Rest of Latin America Lab-as-a-Service Market Analysis and Forecasting ($US Bn), by Service Type, 2021-2036
157. Rest of Latin America Lab-as-a-Service Market Analysis and Forecasting ($US Bn), by Lab Type, 2021-2036
158. Rest of Latin America Lab-as-a-Service Market Analysis and Forecasting ($US Bn), by Technology, 2021-2036
159. Rest of Latin America Lab-as-a-Service Market Analysis and Forecasting ($US Bn), by Deployment Type, 2021-2036
160. Rest of Latin America Lab-as-a-Service Market Analysis and Forecasting ($US Bn), by Application, 2021-2036
161. Rest of Latin America Lab-as-a-Service Market Analysis and Forecasting ($US Bn), by End-user, 2021-2036
162. Middle East & Africa Lab-as-a-Service Market Analysis and Forecasting ($US Bn), by Service Type, 2021-2036
163. Middle East & Africa Lab-as-a-Service Market Analysis and Forecasting ($US Bn), by Lab Type, 2021-2036
164. Middle East & Africa Lab-as-a-Service Market Analysis and Forecasting ($US Bn), by Technology, 2021-2036
165. Middle East & Africa Lab-as-a-Service Market Analysis and Forecasting ($US Bn), by Deployment Type, 2021-2036
166. Middle East & Africa Lab-as-a-Service Market Analysis and Forecasting ($US Bn), by Application, 2021-2036
167. Middle East & Africa Lab-as-a-Service Market Analysis and Forecasting ($US Bn), by End-user, 2021-2036
168. Saudi Arabia Lab-as-a-Service Market Analysis and Forecasting ($US Bn), by Service Type, 2021-2036
169. Saudi Arabia Lab-as-a-Service Market Analysis and Forecasting ($US Bn), by Lab Type, 2021-2036
170. Saudi Arabia Lab-as-a-Service Market Analysis and Forecasting ($US Bn), by Technology, 2021-2036
171. Saudi Arabia Lab-as-a-Service Market Analysis and Forecasting ($US Bn), by Deployment Type, 2021-2036
172. Saudi Arabia Lab-as-a-Service Market Analysis and Forecasting ($US Bn), by Application, 2021-2036
173. Saudi Arabia Lab-as-a-Service Market Analysis and Forecasting ($US Bn), by End-user, 2021-2036
174. UAE Lab-as-a-Service Market Analysis and Forecasting ($US Bn), by Service Type, 2021-2036
175. UAE Lab-as-a-Service Market Analysis and Forecasting ($US Bn), by Lab Type, 2021-2036
176. UAE Lab-as-a-Service Market Analysis and Forecasting ($US Bn), by Technology, 2021-2036
177. UAE Lab-as-a-Service Market Analysis and Forecasting ($US Bn), by Deployment Type, 2021-2036
178. UAE Lab-as-a-Service Market Analysis and Forecasting ($US Bn), by Application, 2021-2036
179. UAE Lab-as-a-Service Market Analysis and Forecasting ($US Bn), by End-user, 2021-2036
180. South Africa Lab-as-a-Service Market Analysis and Forecasting ($US Bn), by Service Type, 2021-2036
181. South Africa Lab-as-a-Service Market Analysis and Forecasting ($US Bn), by Lab Type, 2021-2036
182. South Africa Lab-as-a-Service Market Analysis and Forecasting ($US Bn), by Technology, 2021-2036
183. South Africa Lab-as-a-Service Market Analysis and Forecasting ($US Bn), by Deployment Type, 2021-2036
184. South Africa Lab-as-a-Service Market Analysis and Forecasting ($US Bn), by Application, 2021-2036
185. South Africa Lab-as-a-Service Market Analysis and Forecasting ($US Bn), by End-user, 2021-2036
186. Rest of Middle East & Africa Lab-as-a-Service Market Analysis and Forecasting ($US Bn), by Service Type, 2021-2036
187. Rest of Middle East & Africa Lab-as-a-Service Market Analysis and Forecasting ($US Bn), by Lab Type, 2021-2036
188. Rest of Middle East & Africa Lab-as-a-Service Market Analysis and Forecasting ($US Bn), by Technology, 2021-2036
189. Rest of Middle East & Africa Lab-as-a-Service Market Analysis and Forecasting ($US Bn), by Deployment Type, 2021-2036
190. Rest of Middle East & Africa Lab-as-a-Service Market Analysis and Forecasting ($US Bn), by Application, 2021-2036
191. Rest of Middle East & Africa Lab-as-a-Service Market Analysis and Forecasting ($US Bn), by End-user, 2021-2036
192. Competition Landscape
192.1. Market Share Analysis (%), by Company, 2025
192.2. Competitive Benchmarking
192.3. Company Profiles
192.3.1. Emerald Cloud Lab
192.3.1.1. Company Overview
192.3.1.2. Business Portfolio
192.3.1.3. Financials
192.3.1.4. Geographical Footprint
192.3.1.5. SWOT Analysis
192.3.1.6. Recent Developments and Strategies
192.3.2. Strateos
192.3.2.1. Company Overview
192.3.2.2. Business Portfolio
192.3.2.3. Financials
192.3.2.4. Geographical Footprint
192.3.2.5. SWOT Analysis
192.3.2.6. Recent Developments and Strategies
192.3.3. Arctoris
192.3.3.1. Company Overview
192.3.3.2. Business Portfolio
192.3.3.3. Financials
192.3.3.4. Geographical Footprint
192.3.3.5. SWOT Analysis
192.3.3.6. Recent Developments and Strategies
192.3.4. Culture Biosciences
192.3.4.1. Company Overview
192.3.4.2. Business Portfolio
192.3.4.3. Financials
192.3.4.4. Geographical Footprint
192.3.4.5. SWOT Analysis
192.3.4.6. Recent Developments and Strategies
192.3.5. Benchling
192.3.5.1. Company Overview
192.3.5.2. Business Portfolio
192.3.5.3. Financials
192.3.5.4. Geographical Footprint
192.3.5.5. SWOT Analysis
192.3.5.6. Recent Developments and Strategies
192.3.6. BioLabs
192.3.6.1. Company Overview
192.3.6.2. Business Portfolio
192.3.6.3. Financials
192.3.6.4. Geographical Footprint
192.3.6.5. SWOT Analysis
192.3.6.6. Recent Developments and Strategies
192.3.7. LabCentral
192.3.7.1. Company Overview
192.3.7.2. Business Portfolio
192.3.7.3. Financials
192.3.7.4. Geographical Footprint
192.3.7.5. SWOT Analysis
192.3.7.6. Recent Developments and Strategies
192.3.8. MBC BioLabs
192.3.8.1. Company Overview
192.3.8.2. Business Portfolio
192.3.8.3. Financials
192.3.8.4. Geographical Footprint
192.3.8.5. SWOT Analysis
192.3.8.6. Recent Developments and Strategies
192.3.9. SGS
192.3.9.1. Company Overview
192.3.9.2. Business Portfolio
192.3.9.3. Financials
192.3.9.4. Geographical Footprint
192.3.9.5. SWOT Analysis
192.3.9.6. Recent Developments and Strategies
192.3.10. Intertek
192.3.10.1. Company Overview
192.3.10.2. Business Portfolio
192.3.10.3. Financials
192.3.10.4. Geographical Footprint
192.3.10.5. SWOT Analysis
192.3.10.6. Recent Developments and Strategies
192.3.11. Eurofins Scientific
192.3.11.1. Company Overview
192.3.11.2. Business Portfolio
192.3.11.3. Financials
192.3.11.4. Geographical Footprint
192.3.11.5. SWOT Analysis
192.3.11.6. Recent Developments and Strategies
192.3.12. Charles River Laboratories
192.3.12.1. Company Overview
192.3.12.2. Business Portfolio
192.3.12.3. Financials
192.3.12.4. Geographical Footprint
192.3.12.5. SWOT Analysis
192.3.12.6. Recent Developments and Strategies
192.3.13. Labcorp
192.3.13.1. Company Overview
192.3.13.2. Business Portfolio
192.3.13.3. Financials
192.3.13.4. Geographical Footprint
192.3.13.5. SWOT Analysis
192.3.13.6. Recent Developments and Strategies
192.3.14. Thermo Fisher Scientific
192.3.14.1. Company Overview
192.3.14.2. Business Portfolio
192.3.14.3. Financials
192.3.14.4. Geographical Footprint
192.3.14.5. SWOT Analysis
192.3.14.6. Recent Developments and Strategies
192.3.15. Agilent Technologies
192.3.15.1. Company Overview
192.3.15.2. Business Portfolio
192.3.15.3. Financials
192.3.15.4. Geographical Footprint
192.3.15.5. SWOT Analysis
192.3.15.6. Recent Developments and Strategies
192.3.16. Others
193. Appendix
- Get Started -
Get insights that lead to new growth opportunities
- Talk to Experts -
Get answers to your queries on this report from our experts
Frequently Asked Questions
The global Lab-as-a-Service market in 2025 was $US 5.47 Billion.
The global Lab-as-a-Service market will be $US 20.54 Billion by 2036.
What is the expected growth rate (CAGR%) of global Lab-as-a-Service market for the period 2026-2036?
The expected growth rate (CAGR%) of the global Lab-as-a-Service market is 11.6% for the period 2026-2036.
Rising Demand for Cost-Efficient and Scalable R&D Infrastructure and Growth of Laboratory Automation, Cloud Labs, And AI-Enabled Experimentation.
Wet Labs was the largest segment among all in Lab-as-a-Service Market in 2025.
North America was the leading regions for Lab-as-a-Service holding 38.5% of the global market in 2025.
Emerald Cloud Lab, Strateos, Arctoris, Culture Biosciences, Benchling, BioLabs, LabCentral, MBC BioLabs, SGS, Intertek, Eurofins Scientific, Charles River Laboratories, Labcorp, Thermo Fisher Scientific, Agilent Technologies and Others.