
Granulated Blast-furnace Slag (GGBFS) Market
Granulated Blast-furnace Slag (GGBFS) Market (Type: Acidic, Alkaline and Neutral; Slag Content: 5%-30%, 30%-60% and 60%-70%; Grade: Grade 80, Grade 100 and Grade 120; Application: Concrete Road & Flyover, Heritage, Metros, Residential, Commercial & Industrial Complexes, Storage Tank and Others; End-use: Concrete & Civil Engineering, Construction, Infrastructure and Others; and Region: North America, Europe, Asia Pacific, Latin America and Middle East & Africa)– Global Industry Analysis, Shares, Growth, Trends and Forecast 2021-2036
Categories:
All, Chemicals and Materials
| Format: PDF/PPT/Excel
| Product ID:
5018
| Report Version:
October 2026
- Report Preview
- Table of Content
- Request Customization
Market Snappshot
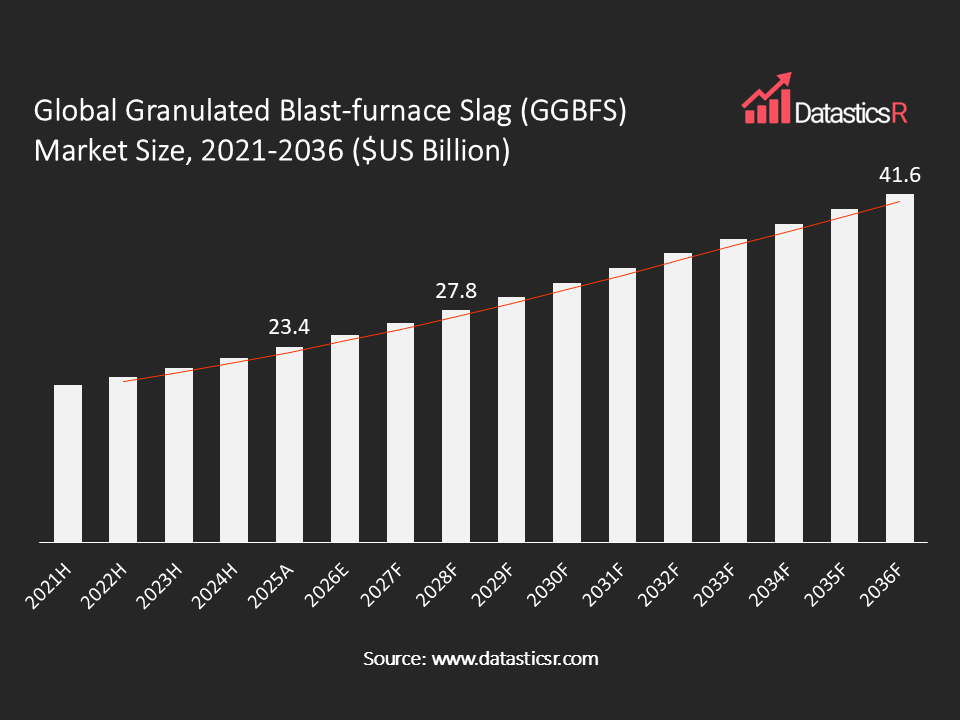
- Market Size in 2025: $US 23.4 Bn
- Forecast Market by 2036: $US 41.6 Bn
- CAGR for the Period 2026-2036: 5.1%
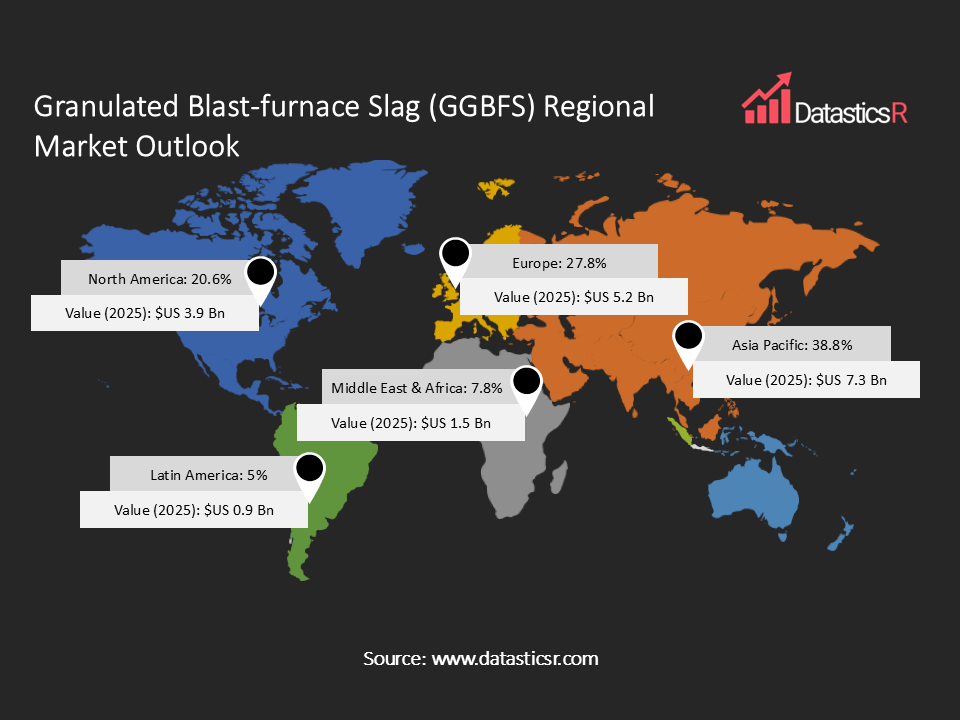
- Top Region in Terms of Market Share: Asia Pacific (38.8%)
- Key Players: Holcim Ltd., Heidelberg Materials AG, CEMEX S.A.B. de C.V., JSW Cement Ltd., Tata Steel Limited, ArcelorMittal, Nippon Steel Corporation, POSCO Holdings Inc., CRH plc, UltraTech Cement Limited, Ecocem Group, Taiheiyo Cement Corporation and Others.
Analyst Viewpoint:
Blast-furnace slag was once a waste product of ironmaking, and it has become one of the few construction materials whose use lowers the carbon footprint of the product it goes into. This gives the market an unusual shape, because demand is driven by cement and concrete buyers while supply is controlled by steel producers. The main uncertainty is therefore on the supply side: as steelmakers move part of their output toward electric arc furnaces and direct reduced iron, the amount of blast-furnace slag available to grind may stop growing in some regions even as demand rises. Quality is a second challenge, since the performance of ground slag depends on its glass content, chemistry and fineness, and these differ between plants and need careful control. At the same time, standards that recognize higher slag contents, government purchasing rules that favor lower-carbon concrete, and investment in grinding and granulation plants close to steel mills and ports are widening where slag can be used. Producers that secure long-term slag supply, grind to consistent grades and offer technical support to concrete producers are likely to hold the stronger position. To realize the full techno-commercial potential of ground granulated blast-furnace slag, close collaboration between steel producers, cement and concrete companies, standards bodies and public infrastructure owners will be essential.
Granulated Blast-furnace Slag (GGBFS) Market Overview:
Ground granulated blast-furnace slag is made by cooling molten slag from an iron blast furnace rapidly with water to form a glassy granulated material, which is then ground to a fine powder. It is a supplementary cementitious material that replaces part of the portland cement or clinker in cement and concrete. It improves long-term strength and durability, and it lowers the carbon dioxide emissions of the binder because less clinker is used. In the United States, ASTM C989 classifies it into Grades 80, 100 and 120 by its slag activity index, which compares the strength of slag-cement mortar with that of reference cement mortar.
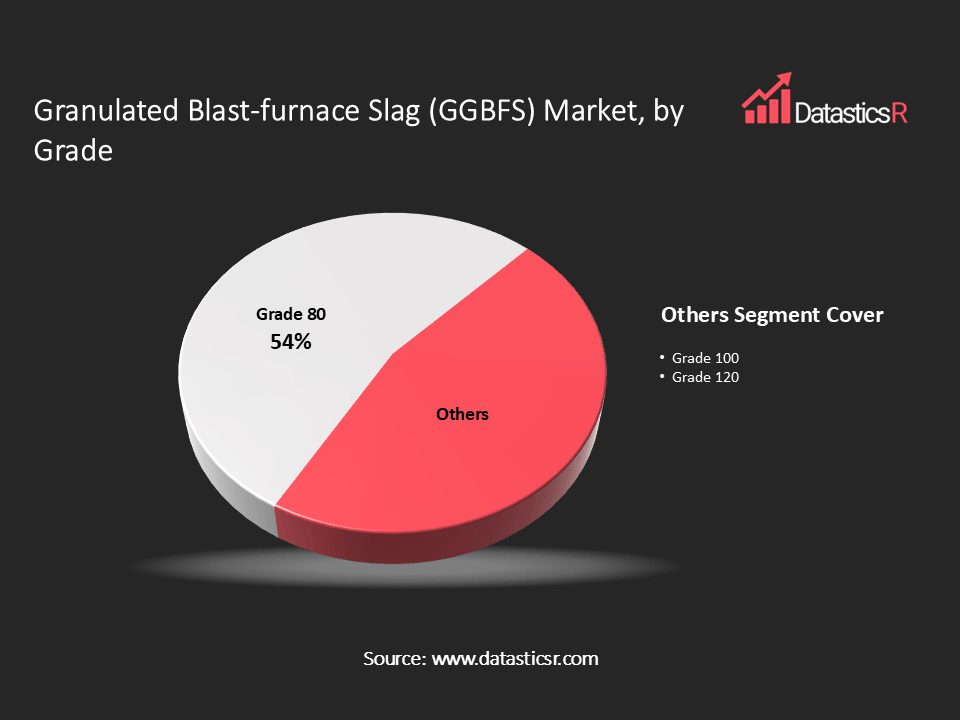
By type, acidic leads with a 70.7% share in 2025, followed by alkaline. By slag content, 30%-60% leads with a 54.3% share, followed by 60%-70%. By grade, Grade 80 leads with a 53.8% share, followed by Grade 100. By application, concrete road & flyover leads with a 42.4% share, followed by residential, commercial & industrial complexes. By end-use, infrastructure leads with a 54.8% share, followed by construction. By region, Asia Pacific leads with a 38.8% share, followed by Europe with 27.8%, North America with 20.6%, Middle East & Africa with 7.8% and Latin America with 5.0%.
The main trend in this market is the growing use of slag at higher replacement levels in cement and concrete, supported by cement-sector net-zero targets and by public infrastructure programs that specify lower-carbon concrete.
| Drivers | Cement Decarbonization Targets and Wider Use of Slag as a Clinker Substitute |
| Public Infrastructure Programs and Government Support for Slag-Blended Concrete |
Cement Decarbonization Targets and Wider Use of Slag as a Clinker Substitute
The cement industry’s net-zero targets rely heavily on replacing clinker, the most carbon-intensive part of cement, and slag is one of the most proven replacements. The Global Cement and Concrete Association describes supplementary cementitious materials as key to reaching net zero by 2050, notes that they typically make up 30% to 50% of the cementitious material in a mix and can exceed 70% in some uses, and reports that concrete with 50% ground granulated blast-furnace slag has a 42% lower carbon footprint than concrete with no such material, compared with 27% for concrete with 30% fly ash.
Europe shows how much slag is already used. EUROSLAG reported that about 19.6 million tons of blast-furnace slag were produced in the European Union in 2024, that 20.0 million tons of granulated slag went into cement, and that the use of slag avoided about 11.4 million tons of carbon dioxide in 2024 and 319 million tons since 2000. In the United States, the US Geological Survey reports that granulated blast-furnace slag made up less than 30% of the roughly 16 million tons of slag sold in 2025 but about 80% of the value, with prices of about $140 per ton or more in some cases.
Because the carbon saving is measured and published by industry and government bodies, cement makers and concrete buyers can use slag to meet emission targets with an established material, which supports demand across regions.
Public Infrastructure Programs and Government Support for Slag-Blended Concrete
Governments are the largest buyers of the roads, flyovers and metro lines that use slag-blended concrete, and they are beginning to write slag into their rules. India’s Press Information Bureau reported in March 2026 that the country’s operational metro network had grown to about 1,095 kilometers in 26 cities in 2025, from 248 kilometers in 5 cities in 2014, with 38 sanctioned projects covering 1,051 kilometers since 2014. In July 2024, NITI Aayog issued guidelines for using processed steel slag aggregates in road construction, which covers steel slag rather than granulated blast-furnace slag but signals policy support for slag use in public works.
The Global Cement and Concrete Association recommends that governments lead by specifying blended cements and supplementary cementitious materials in public projects. According to our projection, India’s use of ground granulated blast-furnace slag will rise to around 46 million tons by 2030. Further, changes in the steel and energy industries will make slag less available in many places, which gives value to producers with secure supply. In the United States, USGS reports that net import reliance for slag was about 13% in 2025, that Japan supplied 60% of imports in 2021 to 2024, and that a new granulator started in the second quarter of 2025 while another was idled.
Public procurement rules, large project pipelines and tight supply together favor producers with reliable slag access and consistent grades.
Granulated Blast-furnace Slag (GGBFS) Regional Market Outlook:
Asia Pacific is the largest market, with a 38.8% share. Demand is supported by India’s metro and road programs, a large base of steel and cement producers such as Tata Steel, JSW Cement, UltraTech Cement, Nippon Steel, POSCO and Taiheiyo Cement, and a forecast rise in Indian slag use to 46 million tons by 2030.
Europe holds a 27.8% share. Demand is supported by cement-sector decarbonization, a well-established slag supply chain that sent 20.0 million tons of granulated slag into cement in 2024, and producers such as Heidelberg Materials, Holcim and Ecocem.
North America holds a 20.6% share. Demand is supported by public infrastructure projects, a domestic slag supply of about 16 million tons sold in 2025 and reliance on imports for part of the high-value granulated product, with suppliers and cement producers such as CEMEX and CRH.
Middle East & Africa holds a 7.8% share and Latin America holds a 5.0% share. Demand in both regions is supported by road, housing and urban construction, and by cement producers such as Votorantim Cimentos in Latin America that blend slag into their cements.
Key Companies in Granulated Blast-furnace Slag (GGBFS) Market:
The market includes steel producers that supply slag, cement and building materials companies, and specialist grinders. Holcim Ltd. of Switzerland, Heidelberg Materials AG of Germany and CEMEX S.A.B. de C.V. of Mexico are global building materials companies that sell slag-blended cement and concrete. JSW Cement Ltd. and Tata Steel Limited of India are a cement maker with access to its parent group’s steel slag and a major steel producer that supplies slag to cement manufacturers. ArcelorMittal, Nippon Steel Corporation and POSCO Holdings Inc. are large steel producers, CRH plc, UltraTech Cement Limited and Taiheiyo Cement Corporation are cement and building materials producers, and Ecocem Group is a specialist supplier of low-carbon cementitious products.
Key players include Holcim Ltd., Heidelberg Materials AG, CEMEX S.A.B. de C.V., JSW Cement Ltd., Tata Steel Limited, ArcelorMittal, Nippon Steel Corporation, POSCO Holdings Inc., CRH plc, UltraTech Cement Limited, Ecocem Group, Taiheiyo Cement Corporation and Others.
Key players include Holcim Ltd., Heidelberg Materials AG, CEMEX S.A.B. de C.V., JSW Cement Ltd., Tata Steel Limited, ArcelorMittal, Nippon Steel Corporation, POSCO Holdings Inc., CRH plc, UltraTech Cement Limited, Ecocem Group, Taiheiyo Cement Corporation and Others.
Key Developments in Granulated Blast-furnace Slag (GGBFS) Market:
| 1. USGS Reports 16 Million Tons of US Slag Sales in 2025: In February 2026, the US Geological Survey reported that slag sales in 2025 stood at 16 million tons worth about $620 million, with granulated blast-furnace slag making up about 80% of the value. |
| 2. EUROSLAG Reported 20.0 Million Tons of Granulated Blast-Furnace Slag Used in Cement In EU: In November 2025, EUROSLAG reported that 20.0 million tons of granulated blast-furnace slag went into cement in the European Union in 2024 and that 92% of available ferrous slag was used. |
Granulated Blast-furnace Slag (GGBFS) Market Attributes:
| Market Value, 2025 | $US 23.4 Billion |
| Forecasted Market Value, 2036 | $US 41.6 Billion |
| CAGR (2026-2036) | 5.3% |
| Analysis Period | 2021-2036 |
| Historic Period | 2021-2024 |
| Base Year | 2025 |
| Forecast Period | 2026-2036 |
| Volume Unit | Tons |
| Value Unit | $US Billion |
| Market Segmentation | By Type
By Slag Content
By Grade
By Application
By End-use
By Region
|
| Companies Profiles |
|
| Customization Request | Available upon request |
1. Introduction
1.1. Report Scope
1.2. Market Segmentations and Definitions
1.3. Geographical Coverage
2. Executive Summary
2.1. Key Facts and Figures
2.2. Trends Impacting the Market
2.3. DatasticsR Growth Opportunity Matrix
3. Market Overview
3.1. Global Granulated Blast-furnace Slag (GGBFS) Market Analysis and Forecast, 2021-2036
3.1.1. Global Granulated Blast-furnace Slag (GGBFS) Market Size (Tons)
3.1.2. Global Granulated Blast-furnace Slag (GGBFS) Market Size ($US Bn)
3.2. Key Market Trends
3.3. Technology Roadmap and Developments
3.4. Market Dynamics
3.4.1. Drivers
3.4.2. Restraints
3.4.3. Opportunities
3.5. Porter’s Five Forces Analysis
3.6. PESTL Analysis
3.7. Industry SWOT Analysis
3.8. Regulatory Landscape
3.9. Value Chain Analysis
3.9.1. List of Raw Materials Suppliers
3.9.2. List of Manufacturers
3.9.3. List of Dealers / Distributors
3.9.4. List of Potential Customers
3.10. Impact of Current Geopolitical Scenario on the Market
4. Technical Analysis
4.1. Product Specifications Analysis
4.2. Technology Adoption and Emerging Technologies
4.3. R&D Trends and Patents Landscape
4.4. Cost Structure and Profitability Analysis
5. Global Production Output Analysis (Tons), by Region, 2025
5.1. North America
5.2. Europe
5.3. Asia Pacific
5.4. Latin America
5.5. Middle East and Africa
6. Import-export Analysis Volume (Tons) and Value ($US Bn), by Key Country, 2021-2025
7. Price Trend Analysis and Forecasting ($US/Ton), 2021-2036
7.1. Price Trend Analysis and Forecasting, by Type
7.2. Price Trend Analysis and Forecasting, by Grade
7.3. Price Trend Analysis and Forecasting, by Region
8. Global Granulated Blast-furnace Slag (GGBFS) Market Analysis and Forecasting (Tons) ($US Bn), by Type, 2021-2036
9. Global Granulated Blast-furnace Slag (GGBFS) Market Analysis and Forecasting (Tons) ($US Bn), by Slag Content, 2021-2036
10. Global Granulated Blast-furnace Slag (GGBFS) Market Analysis and Forecasting (Tons) ($US Bn), by Grade, 2021-2036
11. Global Granulated Blast-furnace Slag (GGBFS) Market Analysis and Forecasting (Tons) ($US Bn), by Application, 2021-2036
12. Global Granulated Blast-furnace Slag (GGBFS) Market Analysis and Forecasting (Tons) ($US Bn), by End-use, 2021-2036
13. Global Granulated Blast-furnace Slag (GGBFS) Market Analysis and Forecasting (Tons) ($US Bn), by Region, 2021-2036
14. North America Granulated Blast-furnace Slag (GGBFS) Market Analysis and Forecasting (Tons) ($US Bn), by Type, 2021-2036
15. North America Granulated Blast-furnace Slag (GGBFS) Market Analysis and Forecasting (Tons) ($US Bn), by Slag Content, 2021-2036
16. North America Granulated Blast-furnace Slag (GGBFS) Market Analysis and Forecasting (Tons) ($US Bn), by Grade, 2021-2036
17. North America Granulated Blast-furnace Slag (GGBFS) Market Analysis and Forecasting (Tons) ($US Bn), by Application, 2021-2036
18. North America Granulated Blast-furnace Slag (GGBFS) Market Analysis and Forecasting (Tons) ($US Bn), by End-use, 2021-2036
19. U.S. Granulated Blast-furnace Slag (GGBFS) Market Analysis and Forecasting (Tons) ($US Bn), by Type, 2021-2036
20. U.S. Granulated Blast-furnace Slag (GGBFS) Market Analysis and Forecasting (Tons) ($US Bn), by Slag Content, 2021-2036
21. U.S. Granulated Blast-furnace Slag (GGBFS) Market Analysis and Forecasting (Tons) ($US Bn), by Grade, 2021-2036
22. U.S. Granulated Blast-furnace Slag (GGBFS) Market Analysis and Forecasting (Tons) ($US Bn), by Application, 2021-2036
23. U.S. Granulated Blast-furnace Slag (GGBFS) Market Analysis and Forecasting (Tons) ($US Bn), by End-use, 2021-2036
24. Canada Granulated Blast-furnace Slag (GGBFS) Market Analysis and Forecasting (Tons) ($US Bn), by Type, 2021-2036
25. Canada Granulated Blast-furnace Slag (GGBFS) Market Analysis and Forecasting (Tons) ($US Bn), by Slag Content, 2021-2036
26. Canada Granulated Blast-furnace Slag (GGBFS) Market Analysis and Forecasting (Tons) ($US Bn), by Grade, 2021-2036
27. Canada Granulated Blast-furnace Slag (GGBFS) Market Analysis and Forecasting (Tons) ($US Bn), by Application, 2021-2036
28. Canada Granulated Blast-furnace Slag (GGBFS) Market Analysis and Forecasting (Tons) ($US Bn), by End-use, 2021-2036
29. Europe Granulated Blast-furnace Slag (GGBFS) Market Analysis and Forecasting (Tons) ($US Bn), by Type, 2021-2036
30. Europe Granulated Blast-furnace Slag (GGBFS) Market Analysis and Forecasting (Tons) ($US Bn), by Slag Content, 2021-2036
31. Europe Granulated Blast-furnace Slag (GGBFS) Market Analysis and Forecasting (Tons) ($US Bn), by Grade, 2021-2036
32. Europe Granulated Blast-furnace Slag (GGBFS) Market Analysis and Forecasting (Tons) ($US Bn), by Application, 2021-2036
33. Europe Granulated Blast-furnace Slag (GGBFS) Market Analysis and Forecasting (Tons) ($US Bn), by End-use, 2021-2036
34. Germany Granulated Blast-furnace Slag (GGBFS) Market Analysis and Forecasting (Tons) ($US Bn), by Type, 2021-2036
35. Germany Granulated Blast-furnace Slag (GGBFS) Market Analysis and Forecasting (Tons) ($US Bn), by Slag Content, 2021-2036
36. Germany Granulated Blast-furnace Slag (GGBFS) Market Analysis and Forecasting (Tons) ($US Bn), by Grade, 2021-2036
37. Germany Granulated Blast-furnace Slag (GGBFS) Market Analysis and Forecasting (Tons) ($US Bn), by Application, 2021-2036
38. Germany Granulated Blast-furnace Slag (GGBFS) Market Analysis and Forecasting (Tons) ($US Bn), by End-use, 2021-2036
39. U.K. Granulated Blast-furnace Slag (GGBFS) Market Analysis and Forecasting (Tons) ($US Bn), by Type, 2021-2036
40. U.K. Granulated Blast-furnace Slag (GGBFS) Market Analysis and Forecasting (Tons) ($US Bn), by Slag Content, 2021-2036
41. U.K. Granulated Blast-furnace Slag (GGBFS) Market Analysis and Forecasting (Tons) ($US Bn), by Grade, 2021-2036
42. U.K. Granulated Blast-furnace Slag (GGBFS) Market Analysis and Forecasting (Tons) ($US Bn), by Application, 2021-2036
43. U.K. Granulated Blast-furnace Slag (GGBFS) Market Analysis and Forecasting (Tons) ($US Bn), by End-use, 2021-2036
44. France Granulated Blast-furnace Slag (GGBFS) Market Analysis and Forecasting (Tons) ($US Bn), by Type, 2021-2036
45. France Granulated Blast-furnace Slag (GGBFS) Market Analysis and Forecasting (Tons) ($US Bn), by Slag Content, 2021-2036
46. France Granulated Blast-furnace Slag (GGBFS) Market Analysis and Forecasting (Tons) ($US Bn), by Grade, 2021-2036
47. France Granulated Blast-furnace Slag (GGBFS) Market Analysis and Forecasting (Tons) ($US Bn), by Application, 2021-2036
48. France Granulated Blast-furnace Slag (GGBFS) Market Analysis and Forecasting (Tons) ($US Bn), by End-use, 2021-2036
49. Italy Granulated Blast-furnace Slag (GGBFS) Market Analysis and Forecasting (Tons) ($US Bn), by Type, 2021-2036
50. Italy Granulated Blast-furnace Slag (GGBFS) Market Analysis and Forecasting (Tons) ($US Bn), by Slag Content, 2021-2036
51. Italy Granulated Blast-furnace Slag (GGBFS) Market Analysis and Forecasting (Tons) ($US Bn), by Grade, 2021-2036
52. Italy Granulated Blast-furnace Slag (GGBFS) Market Analysis and Forecasting (Tons) ($US Bn), by Application, 2021-2036
53. Italy Granulated Blast-furnace Slag (GGBFS) Market Analysis and Forecasting (Tons) ($US Bn), by End-use, 2021-2036
54. Spain Granulated Blast-furnace Slag (GGBFS) Market Analysis and Forecasting (Tons) ($US Bn), by Type, 2021-2036
55. Spain Granulated Blast-furnace Slag (GGBFS) Market Analysis and Forecasting (Tons) ($US Bn), by Slag Content, 2021-2036
56. Spain Granulated Blast-furnace Slag (GGBFS) Market Analysis and Forecasting (Tons) ($US Bn), by Grade, 2021-2036
57. Spain Granulated Blast-furnace Slag (GGBFS) Market Analysis and Forecasting (Tons) ($US Bn), by Application, 2021-2036
58. Spain Granulated Blast-furnace Slag (GGBFS) Market Analysis and Forecasting (Tons) ($US Bn), by End-use, 2021-2036
59. Russia & CIS Granulated Blast-furnace Slag (GGBFS) Market Analysis and Forecasting (Tons) ($US Bn), by Type, 2021-2036
60. Russia & CIS Granulated Blast-furnace Slag (GGBFS) Market Analysis and Forecasting (Tons) ($US Bn), by Slag Content, 2021-2036
61. Russia & CIS Granulated Blast-furnace Slag (GGBFS) Market Analysis and Forecasting (Tons) ($US Bn), by Grade, 2021-2036
62. Russia & CIS Granulated Blast-furnace Slag (GGBFS) Market Analysis and Forecasting (Tons) ($US Bn), by Application, 2021-2036
63. Russia & CIS Granulated Blast-furnace Slag (GGBFS) Market Analysis and Forecasting (Tons) ($US Bn), by End-use, 2021-2036
64. Rest of Europe Granulated Blast-furnace Slag (GGBFS) Market Analysis and Forecasting (Tons) ($US Bn), by Type, 2021-2036
65. Rest of Europe Granulated Blast-furnace Slag (GGBFS) Market Analysis and Forecasting (Tons) ($US Bn), by Slag Content, 2021-2036
66. Rest of Europe Granulated Blast-furnace Slag (GGBFS) Market Analysis and Forecasting (Tons) ($US Bn), by Grade, 2021-2036
67. Rest of Europe Granulated Blast-furnace Slag (GGBFS) Market Analysis and Forecasting (Tons) ($US Bn), by Application, 2021-2036
68. Rest of Europe Granulated Blast-furnace Slag (GGBFS) Market Analysis and Forecasting (Tons) ($US Bn), by End-use, 2021-2036
69. Asia Pacific Granulated Blast-furnace Slag (GGBFS) Market Analysis and Forecasting (Tons) ($US Bn), by Type, 2021-2036
70. Asia Pacific Granulated Blast-furnace Slag (GGBFS) Market Analysis and Forecasting (Tons) ($US Bn), by Slag Content, 2021-2036
71. Asia Pacific Granulated Blast-furnace Slag (GGBFS) Market Analysis and Forecasting (Tons) ($US Bn), by Grade, 2021-2036
72. Asia Pacific Granulated Blast-furnace Slag (GGBFS) Market Analysis and Forecasting (Tons) ($US Bn), by Application, 2021-2036
73. Asia Pacific Granulated Blast-furnace Slag (GGBFS) Market Analysis and Forecasting (Tons) ($US Bn), by End-use, 2021-2036
74. China Granulated Blast-furnace Slag (GGBFS) Market Analysis and Forecasting (Tons) ($US Bn), by Type, 2021-2036
75. China Granulated Blast-furnace Slag (GGBFS) Market Analysis and Forecasting (Tons) ($US Bn), by Slag Content, 2021-2036
76. China Granulated Blast-furnace Slag (GGBFS) Market Analysis and Forecasting (Tons) ($US Bn), by Grade, 2021-2036
77. China Granulated Blast-furnace Slag (GGBFS) Market Analysis and Forecasting (Tons) ($US Bn), by Application, 2021-2036
78. China Granulated Blast-furnace Slag (GGBFS) Market Analysis and Forecasting (Tons) ($US Bn), by End-use, 2021-2036
79. India Granulated Blast-furnace Slag (GGBFS) Market Analysis and Forecasting (Tons) ($US Bn), by Type, 2021-2036
80. India Granulated Blast-furnace Slag (GGBFS) Market Analysis and Forecasting (Tons) ($US Bn), by Slag Content, 2021-2036
81. India Granulated Blast-furnace Slag (GGBFS) Market Analysis and Forecasting (Tons) ($US Bn), by Grade, 2021-2036
82. India Granulated Blast-furnace Slag (GGBFS) Market Analysis and Forecasting (Tons) ($US Bn), by Application, 2021-2036
83. India Granulated Blast-furnace Slag (GGBFS) Market Analysis and Forecasting (Tons) ($US Bn), by End-use, 2021-2036
84. Japan Granulated Blast-furnace Slag (GGBFS) Market Analysis and Forecasting (Tons) ($US Bn), by Type, 2021-2036
85. Japan Granulated Blast-furnace Slag (GGBFS) Market Analysis and Forecasting (Tons) ($US Bn), by Slag Content, 2021-2036
86. Japan Granulated Blast-furnace Slag (GGBFS) Market Analysis and Forecasting (Tons) ($US Bn), by Grade, 2021-2036
87. Japan Granulated Blast-furnace Slag (GGBFS) Market Analysis and Forecasting (Tons) ($US Bn), by Application, 2021-2036
88. Japan Granulated Blast-furnace Slag (GGBFS) Market Analysis and Forecasting (Tons) ($US Bn), by End-use, 2021-2036
89. South Korea Granulated Blast-furnace Slag (GGBFS) Market Analysis and Forecasting (Tons) ($US Bn), by Type, 2021-2036
90. South Korea Granulated Blast-furnace Slag (GGBFS) Market Analysis and Forecasting (Tons) ($US Bn), by Slag Content, 2021-2036
91. South Korea Granulated Blast-furnace Slag (GGBFS) Market Analysis and Forecasting (Tons) ($US Bn), by Grade, 2021-2036
92. South Korea Granulated Blast-furnace Slag (GGBFS) Market Analysis and Forecasting (Tons) ($US Bn), by Application, 2021-2036
93. South Korea Granulated Blast-furnace Slag (GGBFS) Market Analysis and Forecasting (Tons) ($US Bn), by End-use, 2021-2036
94. Taiwan Granulated Blast-furnace Slag (GGBFS) Market Analysis and Forecasting (Tons) ($US Bn), by Type, 2021-2036
95. Taiwan Granulated Blast-furnace Slag (GGBFS) Market Analysis and Forecasting (Tons) ($US Bn), by Slag Content, 2021-2036
96. Taiwan Granulated Blast-furnace Slag (GGBFS) Market Analysis and Forecasting (Tons) ($US Bn), by Grade, 2021-2036
97. Taiwan Granulated Blast-furnace Slag (GGBFS) Market Analysis and Forecasting (Tons) ($US Bn), by Application, 2021-2036
98. Taiwan Granulated Blast-furnace Slag (GGBFS) Market Analysis and Forecasting (Tons) ($US Bn), by End-use, 2021-2036
99. Australia Granulated Blast-furnace Slag (GGBFS) Market Analysis and Forecasting (Tons) ($US Bn), by Type, 2021-2036
100. Australia Granulated Blast-furnace Slag (GGBFS) Market Analysis and Forecasting (Tons) ($US Bn), by Slag Content, 2021-2036
101. Australia Granulated Blast-furnace Slag (GGBFS) Market Analysis and Forecasting (Tons) ($US Bn), by Grade, 2021-2036
102. Australia Granulated Blast-furnace Slag (GGBFS) Market Analysis and Forecasting (Tons) ($US Bn), by Application, 2021-2036
103. Australia Granulated Blast-furnace Slag (GGBFS) Market Analysis and Forecasting (Tons) ($US Bn), by End-use, 2021-2036
104. ASEAN Granulated Blast-furnace Slag (GGBFS) Market Analysis and Forecasting (Tons) ($US Bn), by Type, 2021-2036
105. ASEAN Granulated Blast-furnace Slag (GGBFS) Market Analysis and Forecasting (Tons) ($US Bn), by Slag Content, 2021-2036
106. ASEAN Granulated Blast-furnace Slag (GGBFS) Market Analysis and Forecasting (Tons) ($US Bn), by Grade, 2021-2036
107. ASEAN Granulated Blast-furnace Slag (GGBFS) Market Analysis and Forecasting (Tons) ($US Bn), by Application, 2021-2036
108. ASEAN Granulated Blast-furnace Slag (GGBFS) Market Analysis and Forecasting (Tons) ($US Bn), by End-use, 2021-2036
109. Rest of Asia Pacific Granulated Blast-furnace Slag (GGBFS) Market Analysis and Forecasting (Tons) ($US Bn), by Type, 2021-2036
110. Rest of Asia Pacific Granulated Blast-furnace Slag (GGBFS) Market Analysis and Forecasting (Tons) ($US Bn), by Slag Content, 2021-2036
111. Rest of Asia Pacific Granulated Blast-furnace Slag (GGBFS) Market Analysis and Forecasting (Tons) ($US Bn), by Grade, 2021-2036
112. Rest of Asia Pacific Granulated Blast-furnace Slag (GGBFS) Market Analysis and Forecasting (Tons) ($US Bn), by Application, 2021-2036
113. Rest of Asia Pacific Granulated Blast-furnace Slag (GGBFS) Market Analysis and Forecasting (Tons) ($US Bn), by End-use, 2021-2036
114. Latin America Granulated Blast-furnace Slag (GGBFS) Market Analysis and Forecasting (Tons) ($US Bn), by Type, 2021-2036
115. Latin America Granulated Blast-furnace Slag (GGBFS) Market Analysis and Forecasting (Tons) ($US Bn), by Slag Content, 2021-2036
116. Latin America Granulated Blast-furnace Slag (GGBFS) Market Analysis and Forecasting (Tons) ($US Bn), by Grade, 2021-2036
117. Latin America Granulated Blast-furnace Slag (GGBFS) Market Analysis and Forecasting (Tons) ($US Bn), by Application, 2021-2036
118. Latin America Granulated Blast-furnace Slag (GGBFS) Market Analysis and Forecasting (Tons) ($US Bn), by End-use, 2021-2036
119. Brazil Granulated Blast-furnace Slag (GGBFS) Market Analysis and Forecasting (Tons) ($US Bn), by Type, 2021-2036
120. Brazil Granulated Blast-furnace Slag (GGBFS) Market Analysis and Forecasting (Tons) ($US Bn), by Slag Content, 2021-2036
121. Brazil Granulated Blast-furnace Slag (GGBFS) Market Analysis and Forecasting (Tons) ($US Bn), by Grade, 2021-2036
122. Brazil Granulated Blast-furnace Slag (GGBFS) Market Analysis and Forecasting (Tons) ($US Bn), by Application, 2021-2036
123. Brazil Granulated Blast-furnace Slag (GGBFS) Market Analysis and Forecasting (Tons) ($US Bn), by End-use, 2021-2036
124. Mexico Granulated Blast-furnace Slag (GGBFS) Market Analysis and Forecasting (Tons) ($US Bn), by Type, 2021-2036
125. Mexico Granulated Blast-furnace Slag (GGBFS) Market Analysis and Forecasting (Tons) ($US Bn), by Slag Content, 2021-2036
126. Mexico Granulated Blast-furnace Slag (GGBFS) Market Analysis and Forecasting (Tons) ($US Bn), by Grade, 2021-2036
127. Mexico Granulated Blast-furnace Slag (GGBFS) Market Analysis and Forecasting (Tons) ($US Bn), by Application, 2021-2036
128. Mexico Granulated Blast-furnace Slag (GGBFS) Market Analysis and Forecasting (Tons) ($US Bn), by End-use, 2021-2036
129. Argentina Granulated Blast-furnace Slag (GGBFS) Market Analysis and Forecasting (Tons) ($US Bn), by Type, 2021-2036
130. Argentina Granulated Blast-furnace Slag (GGBFS) Market Analysis and Forecasting (Tons) ($US Bn), by Slag Content, 2021-2036
131. Argentina Granulated Blast-furnace Slag (GGBFS) Market Analysis and Forecasting (Tons) ($US Bn), by Grade, 2021-2036
132. Argentina Granulated Blast-furnace Slag (GGBFS) Market Analysis and Forecasting (Tons) ($US Bn), by Application, 2021-2036
133. Argentina Granulated Blast-furnace Slag (GGBFS) Market Analysis and Forecasting (Tons) ($US Bn), by End-use, 2021-2036
134. Rest of Latin America Granulated Blast-furnace Slag (GGBFS) Market Analysis and Forecasting (Tons) ($US Bn), by Type, 2021-2036
135. Rest of Latin America Granulated Blast-furnace Slag (GGBFS) Market Analysis and Forecasting (Tons) ($US Bn), by Slag Content, 2021-2036
136. Rest of Latin America Granulated Blast-furnace Slag (GGBFS) Market Analysis and Forecasting (Tons) ($US Bn), by Grade, 2021-2036
137. Rest of Latin America Granulated Blast-furnace Slag (GGBFS) Market Analysis and Forecasting (Tons) ($US Bn), by Application, 2021-2036
138. Rest of Latin America Granulated Blast-furnace Slag (GGBFS) Market Analysis and Forecasting (Tons) ($US Bn), by End-use, 2021-2036
139. Middle East & Africa Granulated Blast-furnace Slag (GGBFS) Market Analysis and Forecasting (Tons) ($US Bn), by Type, 2021-2036
140. Middle East & Africa Granulated Blast-furnace Slag (GGBFS) Market Analysis and Forecasting (Tons) ($US Bn), by Slag Content, 2021-2036
141. Middle East & Africa Granulated Blast-furnace Slag (GGBFS) Market Analysis and Forecasting (Tons) ($US Bn), by Grade, 2021-2036
142. Middle East & Africa Granulated Blast-furnace Slag (GGBFS) Market Analysis and Forecasting (Tons) ($US Bn), by Application, 2021-2036
143. Middle East & Africa Granulated Blast-furnace Slag (GGBFS) Market Analysis and Forecasting (Tons) ($US Bn), by End-use, 2021-2036
144. Saudi Arabia Granulated Blast-furnace Slag (GGBFS) Market Analysis and Forecasting (Tons) ($US Bn), by Type, 2021-2036
145. Saudi Arabia Granulated Blast-furnace Slag (GGBFS) Market Analysis and Forecasting (Tons) ($US Bn), by Slag Content, 2021-2036
146. Saudi Arabia Granulated Blast-furnace Slag (GGBFS) Market Analysis and Forecasting (Tons) ($US Bn), by Grade, 2021-2036
147. Saudi Arabia Granulated Blast-furnace Slag (GGBFS) Market Analysis and Forecasting (Tons) ($US Bn), by Application, 2021-2036
148. Saudi Arabia Granulated Blast-furnace Slag (GGBFS) Market Analysis and Forecasting (Tons) ($US Bn), by End-use, 2021-2036
149. UAE Granulated Blast-furnace Slag (GGBFS) Market Analysis and Forecasting (Tons) ($US Bn), by Type, 2021-2036
150. UAE Granulated Blast-furnace Slag (GGBFS) Market Analysis and Forecasting (Tons) ($US Bn), by Slag Content, 2021-2036
151. UAE Granulated Blast-furnace Slag (GGBFS) Market Analysis and Forecasting (Tons) ($US Bn), by Grade, 2021-2036
152. UAE Granulated Blast-furnace Slag (GGBFS) Market Analysis and Forecasting (Tons) ($US Bn), by Application, 2021-2036
153. UAE Granulated Blast-furnace Slag (GGBFS) Market Analysis and Forecasting (Tons) ($US Bn), by End-use, 2021-2036
154. South Africa Granulated Blast-furnace Slag (GGBFS) Market Analysis and Forecasting (Tons) ($US Bn), by Type, 2021-2036
155. South Africa Granulated Blast-furnace Slag (GGBFS) Market Analysis and Forecasting (Tons) ($US Bn), by Slag Content, 2021-2036
156. South Africa Granulated Blast-furnace Slag (GGBFS) Market Analysis and Forecasting (Tons) ($US Bn), by Grade, 2021-2036
157. South Africa Granulated Blast-furnace Slag (GGBFS) Market Analysis and Forecasting (Tons) ($US Bn), by Application, 2021-2036
158. South Africa Granulated Blast-furnace Slag (GGBFS) Market Analysis and Forecasting (Tons) ($US Bn), by End-use, 2021-2036
159. Rest of Middle East & Africa Granulated Blast-furnace Slag (GGBFS) Market Analysis and Forecasting (Tons) ($US Bn), by Type, 2021-2036
160. Rest of Middle East & Africa Granulated Blast-furnace Slag (GGBFS) Market Analysis and Forecasting (Tons) ($US Bn), by Slag Content, 2021-2036
161. Rest of Middle East & Africa Granulated Blast-furnace Slag (GGBFS) Market Analysis and Forecasting (Tons) ($US Bn), by Grade, 2021-2036
162. Rest of Middle East & Africa Granulated Blast-furnace Slag (GGBFS) Market Analysis and Forecasting (Tons) ($US Bn), by Application, 2021-2036
163. Rest of Middle East & Africa Granulated Blast-furnace Slag (GGBFS) Market Analysis and Forecasting (Tons) ($US Bn), by End-use, 2021-2036
164. Competition Landscape
164.1. Market Share Analysis (%), by Company, 2025
164.2. Competitive Benchmarking
164.3. Company Profiles
164.3.1. Holcim Ltd.
164.3.1.1. Company Overview
164.3.1.2. Business Portfolio
164.3.1.3. Financials
164.3.1.4. Geographical Footprint
164.3.1.5. SWOT Analysis
164.3.1.6. Recent Developments and Strategies
164.3.2. Heidelberg Materials AG
164.3.2.1. Company Overview
164.3.2.2. Business Portfolio
164.3.2.3. Financials
164.3.2.4. Geographical Footprint
164.3.2.5. SWOT Analysis
164.3.2.6. Recent Developments and Strategies
164.3.3. CEMEX S.A.B. de C.V.
164.3.3.1. Company Overview
164.3.3.2. Business Portfolio
164.3.3.3. Financials
164.3.3.4. Geographical Footprint
164.3.3.5. SWOT Analysis
164.3.3.6. Recent Developments and Strategies
164.3.4. JSW Cement Ltd.
164.3.4.1. Company Overview
164.3.4.2. Business Portfolio
164.3.4.3. Financials
164.3.4.4. Geographical Footprint
164.3.4.5. SWOT Analysis
164.3.4.6. Recent Developments and Strategies
164.3.5. Tata Steel Limited
164.3.5.1. Company Overview
164.3.5.2. Business Portfolio
164.3.5.3. Financials
164.3.5.4. Geographical Footprint
164.3.5.5. SWOT Analysis
164.3.5.6. Recent Developments and Strategies
164.3.6. ArcelorMittal
164.3.6.1. Company Overview
164.3.6.2. Business Portfolio
164.3.6.3. Financials
164.3.6.4. Geographical Footprint
164.3.6.5. SWOT Analysis
164.3.6.6. Recent Developments and Strategies
164.3.7. Nippon Steel Corporation
164.3.7.1. Company Overview
164.3.7.2. Business Portfolio
164.3.7.3. Financials
164.3.7.4. Geographical Footprint
164.3.7.5. SWOT Analysis
164.3.7.6. Recent Developments and Strategies
164.3.8. POSCO Holdings Inc
164.3.8.1. Company Overview
164.3.8.2. Business Portfolio
164.3.8.3. Financials
164.3.8.4. Geographical Footprint
164.3.8.5. SWOT Analysis
164.3.8.6. Recent Developments and Strategies
164.3.9. CRH plc
164.3.9.1. Company Overview
164.3.9.2. Business Portfolio
164.3.9.3. Financials
164.3.9.4. Geographical Footprint
164.3.9.5. SWOT Analysis
164.3.9.6. Recent Developments and Strategies
164.3.10. UltraTech Cement Limited
164.3.10.1. Company Overview
164.3.10.2. Business Portfolio
164.3.10.3. Financials
164.3.10.4. Geographical Footprint
164.3.10.5. SWOT Analysis
164.3.10.6. Recent Developments and Strategies
164.3.11. Ecocem Group
164.3.11.1. Company Overview
164.3.11.2. Business Portfolio
164.3.11.3. Financials
164.3.11.4. Geographical Footprint
164.3.11.5. SWOT Analysis
164.3.11.6. Recent Developments and Strategies
164.3.12. Taiheiyo Cement Corporation
164.3.12.1. Company Overview
164.3.12.2. Business Portfolio
164.3.12.3. Financials
164.3.12.4. Geographical Footprint
164.3.12.5. SWOT Analysis
164.3.12.6. Recent Developments and Strategies
164.3.13. Others
165. Appendix
- Get Started -
Get insights that lead to new growth opportunities
- Talk to Experts -
Get answers to your queries on this report from our experts
Frequently Asked Questions
The global Granulated Blast-furnace Slag (GGBFS) market in 2025 was $US 23.4 Billion.
The global Granulated Blast-furnace Slag (GGBFS) market will be $US 41.6 Billion by 2036.
The expected growth rate (CAGR%) of the global Granulated Blast-furnace Slag (GGBFS) market is 5.1% for the period 2026-2036.
Cement Decarbonization Targets and Wider Use of Slag as a Clinker Substitute and Public Infrastructure Programs and Government Support for Slag-Blended Concrete.
Grade 80 was the largest segment in grade segment with around 53.8% revenue share among all in Granulated Blast-furnace Slag (GGBFS) Market in 2025.
Asia Pacific was the leading regions for Granulated Blast-furnace Slag (GGBFS) holding 38.8% of the global market in 2025.
Holcim Ltd., Heidelberg Materials AG, CEMEX S.A.B. de C.V., JSW Cement Ltd., Tata Steel Limited, ArcelorMittal, Nippon Steel Corporation, POSCO Holdings Inc., CRH plc, UltraTech Cement Limited, Ecocem Group, Taiheiyo Cement Corporation and Others.