
Ethoxylates Market
Ethoxylates Market (Product Type: Alcohol Ethoxylates, Fatty Amine Ethoxylates, Fatty Alcohol Ethoxylates, Ethyl Ester Ethoxylates, Glyceride Ethoxylates and Others; Function: Cleaning Agent, Emulsifying Agent, Wetting Agents and Others; Application: Face Creams, Lotions, Detergents, Shampoos, Sunscreens, Pharmaceutical Ointments, Cleaning Solutions, Herbicides, Insecticides and Others; End-use: Household & Personal Care, Institutional & Industrial Cleaning, Pharmaceutical, Agrochemicals, Textile, Chemicals and Others; and Region: North America, Europe, Asia Pacific, Latin America and Middle East & Africa)– Global Industry Analysis, Shares, Growth, Trends and Forecast 2021-2036
Categories:
All, Chemicals and Materials
| Format: PDF/PPT/Excel
| Product ID:
4972
| Report Version:
October 2026
- Report Preview
- Table of Content
- Request Customization
Market Snappshot
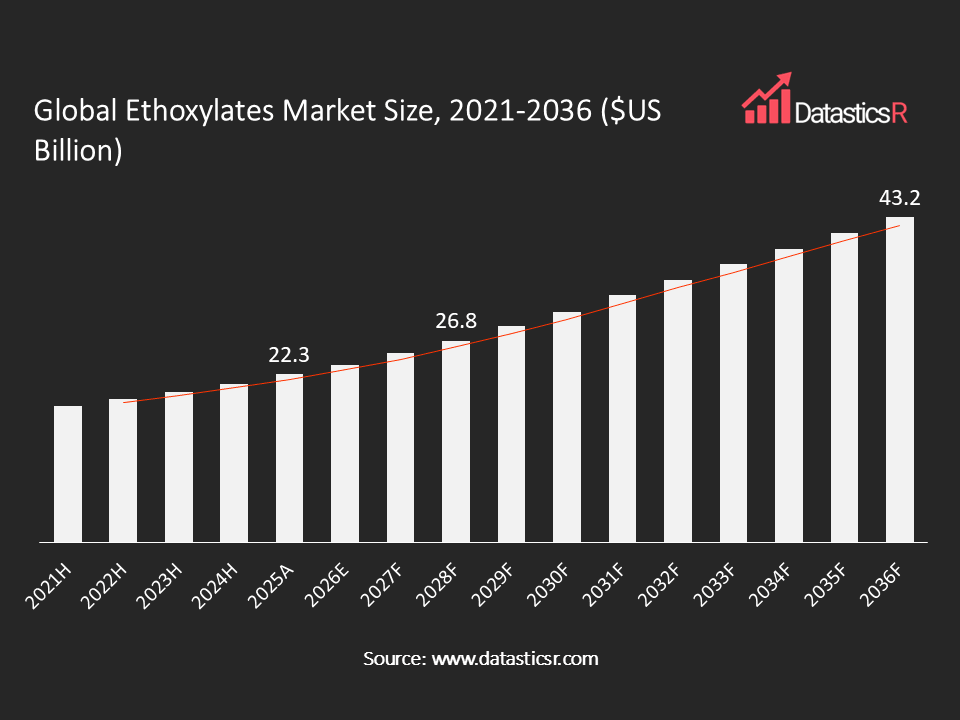
- Market Size in 2025: $US 22.3 Bn
- Forecast Market by 2036: $US 43.2 Bn
- CAGR for the Period 2026-2036: 6.2%
- Top Region in Terms of Market Share: Europe (37.2%)
- Key Players: The Lubrizol Corporation, BASF SE, Evonik Industries AG, Clariant Corporation, SABIC, SEPPIC, The Dow Chemical Company, Solvay, Saibaba Surfactants Pvt. Ltd., Tristar Intermediates, Ethox Chemicals, LLC., Rimpro-india and Others
Analyst Viewpoint:
Ethoxylates sit in a useful position in the chemical value chain, because one family of molecules can be adjusted to clean, to blend oil with water, or to spread a liquid across a surface. This flexibility keeps demand tied to consumer spending and to industrial activity at the same time, so volumes tend to move in line with the wider economy. Competition is increasingly about the quality of each grade, such as chain length control, low impurity levels and the share of renewable carbon, and less about the volume of a standard grade. Producers face the cost swings of ethylene oxide and fatty alcohol feedstocks, and many customers still choose on price. At the same time, customers that must prove the safety and origin of their formulations are willing to commit to suppliers that can supply data, consistent batches and both fossil-based and bio-based options. Producers with integrated feedstock, application laboratories close to customers and clear environmental records are likely to hold the stronger position. To realize the full techno-commercial potential of ethoxylates, close collaboration between feedstock suppliers, ethoxylate producers, formulators, brand owners and regulators will be essential.
Ethoxylates Market Overview:
Ethoxylates are compounds made by reacting ethylene oxide with a starting material such as a fatty alcohol, a fatty amine, a fatty acid ester or a glyceride. The number of ethylene oxide units added sets how water-soluble the product is, and this lets producers tailor it for a given job. Most ethoxylates are nonionic surfactants. They are used as cleaning agents, emulsifiers and wetting agents in detergents, personal care products, crop protection formulations, pharmaceutical ointments and textile processing.
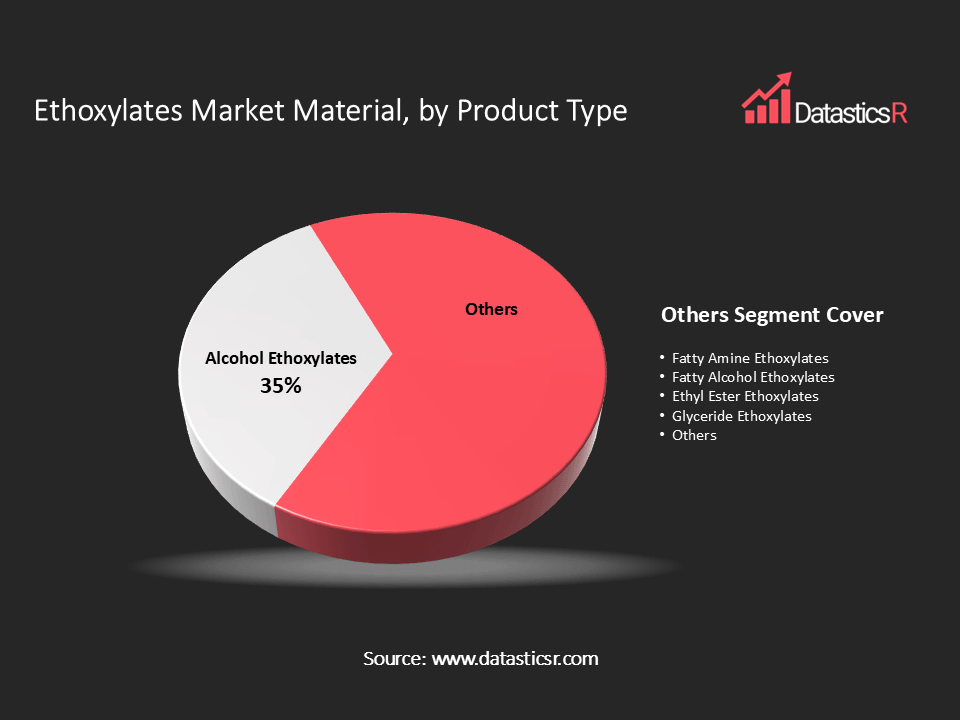
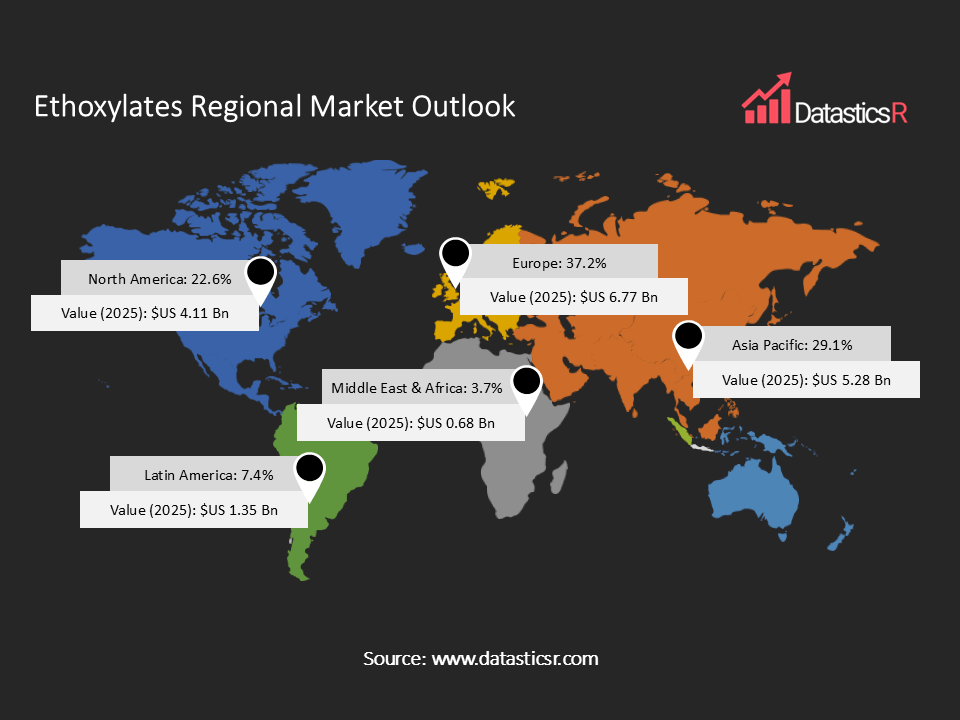
By product type, alcohol ethoxylates lead with a 34.6% share in 2025, followed by fatty amine ethoxylates and fatty alcohol ethoxylates. By function, cleaning agent leads with a 50.7% share, followed by emulsifying agent and wetting agents. By application, detergents lead with a 34.3% share, followed by cleaning solutions and herbicides. By end-use, household & personal care leads with a 49.7% share, followed by agrochemicals and pharmaceutical. By region, Europe leads with a 37.2% share, followed by Asia Pacific with 29.1%, North America with 22.6%, Latin America with 7.4% and Middle East & Africa with 3.7%.
The main trend in this market is the move toward ethoxylates that have low by-product content, better biodegradability and a documented origin, supported by new chemical rules in the United States and Europe and by new ethylene oxide supply in Asia.
| Drivers | Increase in Demand from Detergent Industry |
| Surge in Demand of Ethoxylates in Cosmetic Industry |
Increase in Demand from Detergent Industry
Detergents are the largest single outlet for ethoxylates, which act as nonionic cleaning agents that remove oily soil and work well in cold water and hard water. Demand for them rises with the number of households using automatic washing machines and with the shift from powders to liquids, gels and pods, which depend on liquid surfactants. The global laundry detergent market is projected to surpass $US 100 billion by 2036 at a CAGR more than 5%, with growth linked to rising washing machine sales, hygiene awareness and urbanization.
Company results show the demand across regions. Unilever’s Home Care business grew underlying sales by 2.6% in 2025, with 2.2% from volume, and growth rose to 4.7% in the fourth quarter, with 4.0% from volume. Europe grew strongly, India showed continued strong volume, and Brazil, its second-largest Home Care market, returned to growth in the fourth quarter after a decline earlier in the year. Its Wonder Wash laundry product, launched in 2024, is now in 30 markets.
As consumers move to more concentrated and multi-function formats, formulators need more active surfactant per unit of product, which adds to ethoxylate consumption even when pack sizes shrink.
Surge in Demand of Ethoxylates in Cosmetic Industry
In cosmetics, ethoxylates are used to blend oil and water phases in creams and lotions, to dissolve fragrance and active ingredients, and to provide mild cleansing and foaming in shampoos and washes. Their use increases as the beauty industry grows and as brands launch more products in categories that need these functions, such as haircare, skincare and sun care.
L’Oréal’s sales rose 4% like-for-like to €44.05 billion in 2025. The fastest growth came from the Middle East, South Asia, North Africa and Sub-Saharan Africa at 10.9% and from Latin America at 8.3%, followed by Europe at 4.4% and North America at 3.4%. Haircare grew by double digits in its Consumer Products division, Dermatological Beauty grew 5.5%, and its Professional Products division passed €5 billion in sales for the first time.
The spread of growth across both mature and emerging regions gives ethoxylate producers a broad customer base, with a premium for mild, low-impurity and bio-based grades that suit sensitive-skin and dermatological products.
Ethoxylates Regional Market Outlook:
Europe is the largest market, with a 37.2% share. Demand is supported by the revised Detergents Regulation, a strong base of specialty chemical producers such as BASF, Evonik, Clariant and SEPPIC, and customer interest in bio-based and biodegradable surfactants, although the closure of ethylene capacity adds cost pressure.
Asia Pacific holds a 29.1% share. Demand is supported by new ethylene oxide capacity in China, rising household and personal care consumption in India and Southeast Asia, and the growth of regional producers including Saibaba Surfactants Pvt. Ltd., Tristar Intermediates and Rimpro-india.
North America holds a 22.6% share. Demand is supported by New York State’s 1,4-dioxane limits, which are shaping national formulations, and by a Gulf Coast production base that depends on ethylene oxide plant schedules.
Latin America holds a 7.4% share and Middle East & Africa holds a 3.7% share. Demand in Latin America is supported by household cleaning and crop protection formulations, and in Middle East & Africa by growing household product demand and by producers such as SABIC that supply ethylene-based raw materials.
Key Companies in Ethoxylates Market:
The market includes global chemical producers, specialty surfactant makers and regional producers. BASF SE, The Dow Chemical Company and SABIC are large producers of ethylene oxide and its derivatives. Evonik Industries AG, Clariant Corporation, The Lubrizol Corporation, SEPPIC and Solvay supply specialty surfactants and performance ingredients to personal care, home care and industrial customers. Ethox Chemicals, LLC. is a specialty ethoxylate producer in the United States. Saibaba Surfactants Pvt. Ltd., Tristar Intermediates and Rimpro-india are producers based in India.
Key players include The Lubrizol Corporation, BASF SE, Evonik Industries AG, Clariant Corporation, SABIC, SEPPIC, The Dow Chemical Company, Solvay, Saibaba Surfactants Pvt. Ltd., Tristar Intermediates, Ethox Chemicals, LLC., Rimpro-india and Others.
Key players include The Lubrizol Corporation, BASF SE, Evonik Industries AG, Clariant Corporation, SABIC, SEPPIC, The Dow Chemical Company, Solvay, Saibaba Surfactants Pvt. Ltd., Tristar Intermediates, Ethox Chemicals, LLC., Rimpro-india and Others.
Key Developments in Ethoxylates Market:
| 1. European Parliament Revises EU Detergents Regulation: In January 2026, the Parliament revised the rules to add biodegradability criteria for ingredients other than surfactants, digital labelling and a digital product passport, and a Commission assessment of the most harmful substances. |
| 2. BASF Starts Zhanjiang Complex in China: In November 2025, BASF started its integrated site in Zhanjiang, which includes a 0.66 million ton per year ethylene oxide plant. |
Ethoxylates Market Attributes:
| Market Value, 2025 | $US 22.3 Billion |
| Forecasted Market Value, 2036 | $US 43.2 Billion |
| CAGR (2026-2036) | 6.2% |
| Analysis Period | 2021-2036 |
| Historic Period | 2021-2024 |
| Base Year | 2025 |
| Forecast Period | 2026-2036 |
| Volume Unit | Tons |
| Value Unit | $US Billion |
| Market Segmentation | By Product Type
By Function
By Application
By End-use
By Region
|
| Companies Profiles |
|
| Customization Request | Available upon request |
1. Introduction
1.1. Report Scope
1.2. Market Segmentations and Definitions
1.3. Geographical Coverage
2. Executive Summary
2.1. Key Facts and Figures
2.2. Trends Impacting the Market
2.3. DatasticsR Growth Opportunity Matrix
3. Market Overview
3.1. Global Ethoxylates Market Analysis and Forecast, 2021-2036
3.1.1. Global Ethoxylates Market Size (Tons)
3.1.2. Global Ethoxylates Market Size ($US Bn)
3.2. Key Market Trends
3.3. Technology Roadmap and Developments
3.4. Market Dynamics
3.4.1. Drivers
3.4.2. Restraints
3.4.3. Opportunities
3.5. Porter’s Five Forces Analysis
3.6. PESTL Analysis
3.7. Industry SWOT Analysis
3.8. Regulatory Landscape
3.9. Value Chain Analysis
3.9.1. List of Raw Materials Suppliers
3.9.2. List of Manufacturers
3.9.3. List of Dealers / Distributors
3.9.4. List of Potential Customers
3.10. Impact of Current Geopolitical Scenario on the Market
4. Technical Analysis
4.1. Product Specifications Analysis
4.2. Technology Adoption and Emerging Technologies
4.3. R&D Trends and Patents Landscape
4.4. Cost Structure and Profitability Analysis
5. Global Production Output Analysis (Tons), by Region, 2025
5.1. North America
5.2. Europe
5.3. Asia Pacific
5.4. Latin America
5.5. Middle East and Africa
6. Import-export Analysis Volume (Tons) and Value ($US Bn), by Key Country, 2021-2025
7. Price Trend Analysis and Forecasting ($US/Ton), 2021-2036
7.1. Price Trend Analysis and Forecasting, by Product Type
7.2. Price Trend Analysis and Forecasting, by Region
8. Global Ethoxylates Market Analysis and Forecasting (Tons) ($US Bn), by Product Type, 2021-2036
9. Global Ethoxylates Market Analysis and Forecasting (Tons) ($US Bn), by Function, 2021-2036
10. Global Ethoxylates Market Analysis and Forecasting (Tons) ($US Bn), by Application, 2021-2036
11. Global Ethoxylates Market Analysis and Forecasting (Tons) ($US Bn), by End-use, 2021-2036
12. Global Ethoxylates Market Analysis and Forecasting (Tons) ($US Bn), by Region, 2021-2036
13. North America Ethoxylates Market Analysis and Forecasting (Tons) ($US Bn), by Product Type, 2021-2036
14. North America Ethoxylates Market Analysis and Forecasting (Tons) ($US Bn), by Function, 2021-2036
15. North America Ethoxylates Market Analysis and Forecasting (Tons) ($US Bn), by Application, 2021-2036
16. North America Ethoxylates Market Analysis and Forecasting (Tons) ($US Bn), by End-use, 2021-2036
17. U.S. Ethoxylates Market Analysis and Forecasting (Tons) ($US Bn), by Product Type, 2021-2036
18. U.S. Ethoxylates Market Analysis and Forecasting (Tons) ($US Bn), by Function, 2021-2036
19. U.S. Ethoxylates Market Analysis and Forecasting (Tons) ($US Bn), by Application, 2021-2036
20. U.S. Ethoxylates Market Analysis and Forecasting (Tons) ($US Bn), by End-use, 2021-2036
21. Canada Ethoxylates Market Analysis and Forecasting (Tons) ($US Bn), by Product Type, 2021-2036
22. Canada Ethoxylates Market Analysis and Forecasting (Tons) ($US Bn), by Function, 2021-2036
23. Canada Ethoxylates Market Analysis and Forecasting (Tons) ($US Bn), by Application, 2021-2036
24. Canada Ethoxylates Market Analysis and Forecasting (Tons) ($US Bn), by End-use, 2021-2036
25. Europe Ethoxylates Market Analysis and Forecasting (Tons) ($US Bn), by Product Type, 2021-2036
26. Europe Ethoxylates Market Analysis and Forecasting (Tons) ($US Bn), by Function, 2021-2036
27. Europe Ethoxylates Market Analysis and Forecasting (Tons) ($US Bn), by Application, 2021-2036
28. Europe Ethoxylates Market Analysis and Forecasting (Tons) ($US Bn), by End-use, 2021-2036
29. Germany Ethoxylates Market Analysis and Forecasting (Tons) ($US Bn), by Product Type, 2021-2036
30. Germany Ethoxylates Market Analysis and Forecasting (Tons) ($US Bn), by Function, 2021-2036
31. Germany Ethoxylates Market Analysis and Forecasting (Tons) ($US Bn), by Application, 2021-2036
32. Germany Ethoxylates Market Analysis and Forecasting (Tons) ($US Bn), by End-use, 2021-2036
33. U.K. Ethoxylates Market Analysis and Forecasting (Tons) ($US Bn), by Product Type, 2021-2036
34. U.K. Ethoxylates Market Analysis and Forecasting (Tons) ($US Bn), by Function, 2021-2036
35. U.K. Ethoxylates Market Analysis and Forecasting (Tons) ($US Bn), by Application, 2021-2036
36. U.K. Ethoxylates Market Analysis and Forecasting (Tons) ($US Bn), by End-use, 2021-2036
37. France Ethoxylates Market Analysis and Forecasting (Tons) ($US Bn), by Product Type, 2021-2036
38. France Ethoxylates Market Analysis and Forecasting (Tons) ($US Bn), by Function, 2021-2036
39. France Ethoxylates Market Analysis and Forecasting (Tons) ($US Bn), by Application, 2021-2036
40. France Ethoxylates Market Analysis and Forecasting (Tons) ($US Bn), by End-use, 2021-2036
41. Italy Ethoxylates Market Analysis and Forecasting (Tons) ($US Bn), by Product Type, 2021-2036
42. Italy Ethoxylates Market Analysis and Forecasting (Tons) ($US Bn), by Function, 2021-2036
43. Italy Ethoxylates Market Analysis and Forecasting (Tons) ($US Bn), by Application, 2021-2036
44. Italy Ethoxylates Market Analysis and Forecasting (Tons) ($US Bn), by End-use, 2021-2036
45. Spain Ethoxylates Market Analysis and Forecasting (Tons) ($US Bn), by Product Type, 2021-2036
46. Spain Ethoxylates Market Analysis and Forecasting (Tons) ($US Bn), by Function, 2021-2036
47. Spain Ethoxylates Market Analysis and Forecasting (Tons) ($US Bn), by Application, 2021-2036
48. Spain Ethoxylates Market Analysis and Forecasting (Tons) ($US Bn), by End-use, 2021-2036
49. Russia & CIS Ethoxylates Market Analysis and Forecasting (Tons) ($US Bn), by Product Type, 2021-2036
50. Russia & CIS Ethoxylates Market Analysis and Forecasting (Tons) ($US Bn), by Function, 2021-2036
51. Russia & CIS Ethoxylates Market Analysis and Forecasting (Tons) ($US Bn), by Application, 2021-2036
52. Russia & CIS Ethoxylates Market Analysis and Forecasting (Tons) ($US Bn), by End-use, 2021-2036
53. Rest of Europe Ethoxylates Market Analysis and Forecasting (Tons) ($US Bn), by Product Type, 2021-2036
54. Rest of Europe Ethoxylates Market Analysis and Forecasting (Tons) ($US Bn), by Function, 2021-2036
55. Rest of Europe Ethoxylates Market Analysis and Forecasting (Tons) ($US Bn), by Application, 2021-2036
56. Rest of Europe Ethoxylates Market Analysis and Forecasting (Tons) ($US Bn), by End-use, 2021-2036
57. Asia Pacific Ethoxylates Market Analysis and Forecasting (Tons) ($US Bn), by Product Type, 2021-2036
58. Asia Pacific Ethoxylates Market Analysis and Forecasting (Tons) ($US Bn), by Function, 2021-2036
59. Asia Pacific Ethoxylates Market Analysis and Forecasting (Tons) ($US Bn), by Application, 2021-2036
60. Asia Pacific Ethoxylates Market Analysis and Forecasting (Tons) ($US Bn), by End-use, 2021-2036
61. China Ethoxylates Market Analysis and Forecasting (Tons) ($US Bn), by Product Type, 2021-2036
62. China Ethoxylates Market Analysis and Forecasting (Tons) ($US Bn), by Function, 2021-2036
63. China Ethoxylates Market Analysis and Forecasting (Tons) ($US Bn), by Application, 2021-2036
64. China Ethoxylates Market Analysis and Forecasting (Tons) ($US Bn), by End-use, 2021-2036
65. India Ethoxylates Market Analysis and Forecasting (Tons) ($US Bn), by Product Type, 2021-2036
66. India Ethoxylates Market Analysis and Forecasting (Tons) ($US Bn), by Function, 2021-2036
67. India Ethoxylates Market Analysis and Forecasting (Tons) ($US Bn), by Application, 2021-2036
68. India Ethoxylates Market Analysis and Forecasting (Tons) ($US Bn), by End-use, 2021-2036
69. Japan Ethoxylates Market Analysis and Forecasting (Tons) ($US Bn), by Product Type, 2021-2036
70. Japan Ethoxylates Market Analysis and Forecasting (Tons) ($US Bn), by Function, 2021-2036
71. Japan Ethoxylates Market Analysis and Forecasting (Tons) ($US Bn), by Application, 2021-2036
72. Japan Ethoxylates Market Analysis and Forecasting (Tons) ($US Bn), by End-use, 2021-2036
73. South Korea Ethoxylates Market Analysis and Forecasting (Tons) ($US Bn), by Product Type, 2021-2036
74. South Korea Ethoxylates Market Analysis and Forecasting (Tons) ($US Bn), by Function, 2021-2036
75. South Korea Ethoxylates Market Analysis and Forecasting (Tons) ($US Bn), by Application, 2021-2036
76. South Korea Ethoxylates Market Analysis and Forecasting (Tons) ($US Bn), by End-use, 2021-2036
77. Taiwan Ethoxylates Market Analysis and Forecasting (Tons) ($US Bn), by Product Type, 2021-2036
78. Taiwan Ethoxylates Market Analysis and Forecasting (Tons) ($US Bn), by Function, 2021-2036
79. Taiwan Ethoxylates Market Analysis and Forecasting (Tons) ($US Bn), by Application, 2021-2036
80. Taiwan Ethoxylates Market Analysis and Forecasting (Tons) ($US Bn), by End-use, 2021-2036
81. Australia Ethoxylates Market Analysis and Forecasting (Tons) ($US Bn), by Product Type, 2021-2036
82. Australia Ethoxylates Market Analysis and Forecasting (Tons) ($US Bn), by Function, 2021-2036
83. Australia Ethoxylates Market Analysis and Forecasting (Tons) ($US Bn), by Application, 2021-2036
84. Australia Ethoxylates Market Analysis and Forecasting (Tons) ($US Bn), by End-use, 2021-2036
85. ASEAN Ethoxylates Market Analysis and Forecasting (Tons) ($US Bn), by Product Type, 2021-2036
86. ASEAN Ethoxylates Market Analysis and Forecasting (Tons) ($US Bn), by Function, 2021-2036
87. ASEAN Ethoxylates Market Analysis and Forecasting (Tons) ($US Bn), by Application, 2021-2036
88. ASEAN Ethoxylates Market Analysis and Forecasting (Tons) ($US Bn), by End-use, 2021-2036
89. Rest of Asia Pacific Ethoxylates Market Analysis and Forecasting (Tons) ($US Bn), by Product Type, 2021-2036
90. Rest of Asia Pacific Ethoxylates Market Analysis and Forecasting (Tons) ($US Bn), by Function, 2021-2036
91. Rest of Asia Pacific Ethoxylates Market Analysis and Forecasting (Tons) ($US Bn), by Application, 2021-2036
92. Rest of Asia Pacific Ethoxylates Market Analysis and Forecasting (Tons) ($US Bn), by End-use, 2021-2036
93. Latin America Ethoxylates Market Analysis and Forecasting (Tons) ($US Bn), by Product Type, 2021-2036
94. Latin America Ethoxylates Market Analysis and Forecasting (Tons) ($US Bn), by Function, 2021-2036
95. Latin America Ethoxylates Market Analysis and Forecasting (Tons) ($US Bn), by Application, 2021-2036
96. Latin America Ethoxylates Market Analysis and Forecasting (Tons) ($US Bn), by End-use, 2021-2036
97. Brazil Ethoxylates Market Analysis and Forecasting (Tons) ($US Bn), by Product Type, 2021-2036
98. Brazil Ethoxylates Market Analysis and Forecasting (Tons) ($US Bn), by Function, 2021-2036
99. Brazil Ethoxylates Market Analysis and Forecasting (Tons) ($US Bn), by Application, 2021-2036
100. Brazil Ethoxylates Market Analysis and Forecasting (Tons) ($US Bn), by End-use, 2021-2036
101. Mexico Ethoxylates Market Analysis and Forecasting (Tons) ($US Bn), by Product Type, 2021-2036
102. Mexico Ethoxylates Market Analysis and Forecasting (Tons) ($US Bn), by Function, 2021-2036
103. Mexico Ethoxylates Market Analysis and Forecasting (Tons) ($US Bn), by Application, 2021-2036
104. Mexico Ethoxylates Market Analysis and Forecasting (Tons) ($US Bn), by End-use, 2021-2036
105. Argentina Ethoxylates Market Analysis and Forecasting (Tons) ($US Bn), by Product Type, 2021-2036
106. Argentina Ethoxylates Market Analysis and Forecasting (Tons) ($US Bn), by Function, 2021-2036
107. Argentina Ethoxylates Market Analysis and Forecasting (Tons) ($US Bn), by Application, 2021-2036
108. Argentina Ethoxylates Market Analysis and Forecasting (Tons) ($US Bn), by End-use, 2021-2036
109. Rest of Latin America Ethoxylates Market Analysis and Forecasting (Tons) ($US Bn), by Product Type, 2021-2036
110. Rest of Latin America Ethoxylates Market Analysis and Forecasting (Tons) ($US Bn), by Function, 2021-2036
111. Rest of Latin America Ethoxylates Market Analysis and Forecasting (Tons) ($US Bn), by Application, 2021-2036
112. Rest of Latin America Ethoxylates Market Analysis and Forecasting (Tons) ($US Bn), by End-use, 2021-2036
113. Middle East & Africa Ethoxylates Market Analysis and Forecasting (Tons) ($US Bn), by Product Type, 2021-2036
114. Middle East & Africa Ethoxylates Market Analysis and Forecasting (Tons) ($US Bn), by Function, 2021-2036
115. Middle East & Africa Ethoxylates Market Analysis and Forecasting (Tons) ($US Bn), by Application, 2021-2036
116. Middle East & Africa Ethoxylates Market Analysis and Forecasting (Tons) ($US Bn), by End-use, 2021-2036
117. Saudi Arabia Ethoxylates Market Analysis and Forecasting (Tons) ($US Bn), by Product Type, 2021-2036
118. Saudi Arabia Ethoxylates Market Analysis and Forecasting (Tons) ($US Bn), by Function, 2021-2036
119. Saudi Arabia Ethoxylates Market Analysis and Forecasting (Tons) ($US Bn), by Application, 2021-2036
120. Saudi Arabia Ethoxylates Market Analysis and Forecasting (Tons) ($US Bn), by End-use, 2021-2036
121. UAE Ethoxylates Market Analysis and Forecasting (Tons) ($US Bn), by Product Type, 2021-2036
122. UAE Ethoxylates Market Analysis and Forecasting (Tons) ($US Bn), by Function, 2021-2036
123. UAE Ethoxylates Market Analysis and Forecasting (Tons) ($US Bn), by Application, 2021-2036
124. UAE Ethoxylates Market Analysis and Forecasting (Tons) ($US Bn), by End-use, 2021-2036
125. South Africa Ethoxylates Market Analysis and Forecasting (Tons) ($US Bn), by Product Type, 2021-2036
126. South Africa Ethoxylates Market Analysis and Forecasting (Tons) ($US Bn), by Function, 2021-2036
127. South Africa Ethoxylates Market Analysis and Forecasting (Tons) ($US Bn), by Application, 2021-2036
128. South Africa Ethoxylates Market Analysis and Forecasting (Tons) ($US Bn), by End-use, 2021-2036
129. Rest of Middle East & Africa Ethoxylates Market Analysis and Forecasting (Tons) ($US Bn), by Product Type, 2021-2036
130. Rest of Middle East & Africa Ethoxylates Market Analysis and Forecasting (Tons) ($US Bn), by Function, 2021-2036
131. Rest of Middle East & Africa Ethoxylates Market Analysis and Forecasting (Tons) ($US Bn), by Application, 2021-2036
132. Rest of Middle East & Africa Ethoxylates Market Analysis and Forecasting (Tons) ($US Bn), by End-use, 2021-2036
133. Competition Landscape
133.1. Market Share Analysis (%), by Company, 2025
133.2. Competitive Benchmarking
133.3. Company Profiles
133.3.1. The Lubrizol Corporation
133.3.1.1. Company Overview
133.3.1.2. Business Portfolio
133.3.1.3. Financials
133.3.1.4. Geographical Footprint
133.3.1.5. SWOT Analysis
133.3.1.6. Recent Developments and Strategies
133.3.2. BASF SE
133.3.2.1. Company Overview
133.3.2.2. Business Portfolio
133.3.2.3. Financials
133.3.2.4. Geographical Footprint
133.3.2.5. SWOT Analysis
133.3.2.6. Recent Developments and Strategies
133.3.3. Evonik Industries AG
133.3.3.1. Company Overview
133.3.3.2. Business Portfolio
133.3.3.3. Financials
133.3.3.4. Geographical Footprint
133.3.3.5. SWOT Analysis
133.3.3.6. Recent Developments and Strategies
133.3.4. Clariant Corporation
133.3.4.1. Company Overview
133.3.4.2. Business Portfolio
133.3.4.3. Financials
133.3.4.4. Geographical Footprint
133.3.4.5. SWOT Analysis
133.3.4.6. Recent Developments and Strategies
133.3.5. SABIC
133.3.5.1. Company Overview
133.3.5.2. Business Portfolio
133.3.5.3. Financials
133.3.5.4. Geographical Footprint
133.3.5.5. SWOT Analysis
133.3.5.6. Recent Developments and Strategies
133.3.6. SEPPIC
133.3.6.1. Company Overview
133.3.6.2. Business Portfolio
133.3.6.3. Financials
133.3.6.4. Geographical Footprint
133.3.6.5. SWOT Analysis
133.3.6.6. Recent Developments and Strategies
133.3.7. The Dow Chemical Company
133.3.7.1. Company Overview
133.3.7.2. Business Portfolio
133.3.7.3. Financials
133.3.7.4. Geographical Footprint
133.3.7.5. SWOT Analysis
133.3.7.6. Recent Developments and Strategies
133.3.8. Solvay
133.3.8.1. Company Overview
133.3.8.2. Business Portfolio
133.3.8.3. Financials
133.3.8.4. Geographical Footprint
133.3.8.5. SWOT Analysis
133.3.8.6. Recent Developments and Strategies
133.3.9. Saibaba Surfactants Pvt. Ltd.
133.3.9.1. Company Overview
133.3.9.2. Business Portfolio
133.3.9.3. Financials
133.3.9.4. Geographical Footprint
133.3.9.5. SWOT Analysis
133.3.9.6. Recent Developments and Strategies
133.3.10. Tristar Intermediates
133.3.10.1. Company Overview
133.3.10.2. Business Portfolio
133.3.10.3. Financials
133.3.10.4. Geographical Footprint
133.3.10.5. SWOT Analysis
133.3.10.6. Recent Developments and Strategies
133.3.11. Ethox Chemicals, LLC.
133.3.11.1. Company Overview
133.3.11.2. Business Portfolio
133.3.11.3. Financials
133.3.11.4. Geographical Footprint
133.3.11.5. SWOT Analysis
133.3.11.6. Recent Developments and Strategies
133.3.12. Rimpro-india
133.3.12.1. Company Overview
133.3.12.2. Business Portfolio
133.3.12.3. Financials
133.3.12.4. Geographical Footprint
133.3.12.5. SWOT Analysis
133.3.12.6. Recent Developments and Strategies
133.3.13. Others
134. Appendix
- Get Started -
Get insights that lead to new growth opportunities
- Talk to Experts -
Get answers to your queries on this report from our experts
Frequently Asked Questions
The global Ethoxylates market in 2025 was $US 22.3 Billion.
The global Ethoxylates market will be $US 43.2 Billion by 2036.
The expected growth rate (CAGR%) of the global Ethoxylates market is 6.2% for the period 2026-2036.
Increase in Demand from Detergent Industry and Surge in Demand of Ethoxylates in Cosmetic Industry.
Alcohol Ethoxylates was the largest segment in product type segment with around 34.6% revenue share among all in Ethoxylates Market in 2025.
Europe was the leading regions for Ethoxylates holding 37.2% of the global market in 2025.
The Lubrizol Corporation, BASF SE, Evonik Industries AG, Clariant Corporation, SABIC, SEPPIC, The Dow Chemical Company, Solvay, Saibaba Surfactants Pvt. Ltd., Tristar Intermediates, Ethox Chemicals, LLC., Rimpro-india and Others.