

Global Base Oil Market
Base Oil Market (Group: Group I (SN 150, BS 150, SN 250, SN 500 and Others), Group II (N 150, N 500, N 600 and Others), Group II+, Group III (2 cSt, 4 cSt, 6 cSt), Group III+, Group IV (PAO), Group V (excluding Naphthenic) and Others; Application: Automotive Fluids (Engine Oil, Gear Oil, Transmission Fluids, Brake Fluid and Others), Process Oil (Rubber Process Oil, Textile Process Oil), Industrial Oil (Transformer Oil, Turbine Oil, Food Grade Oil and Others), Metalworking Fluid (Emulsions, Neat Oil), Hydraulic Oil (Petroleum-based, Biodegradable) and Others) – Global Industry Analysis, Shares, Growth, Trends and Forecast 2021-2036
Categories:
All, Chemicals and Materials
| Format: PDF/PPT/Excel
| Product ID:
4256
| Report Version:
April 2026
- Report Preview
- Table of Content
- Request Customization
Market Snappshot
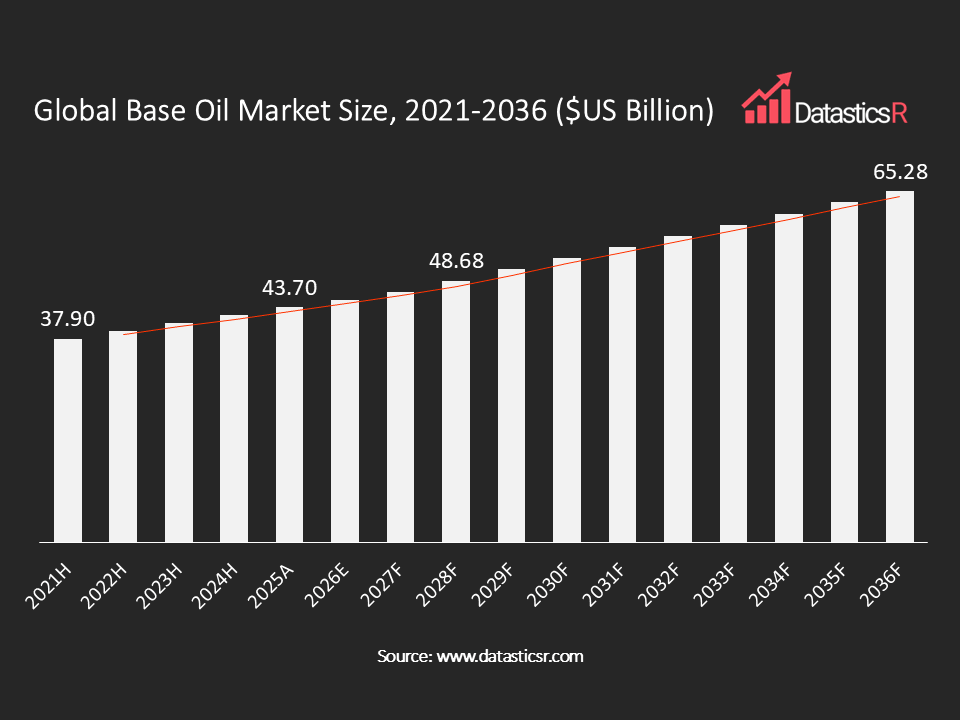
- Market Size in 2025: $US 43.70 Bn
- Forecast Market by 2036: $US 65.28 Bn
- CAGR for the Period 2026-2036: 3.8%
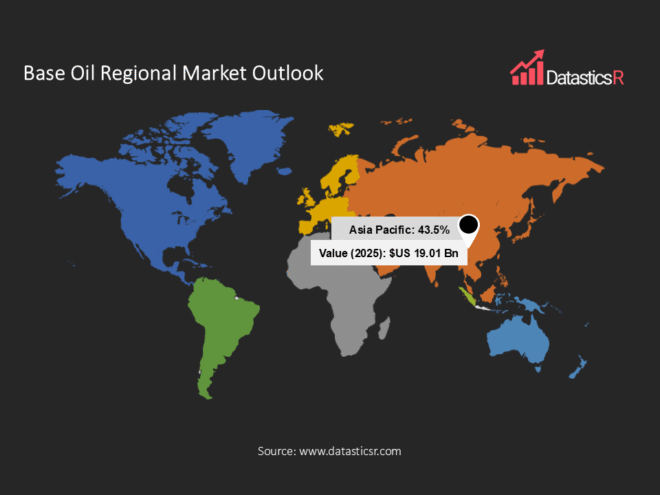
- Top Region in Terms of Market Share: Asia Pacific (43.5%)
- Key Players: Shell plc, ExxonMobil Corporation, Chevron Corporation, BP plc, TotalEnergies SE, SK Lubricants Co. Ltd., ADNOC, Petronas Lubricants International, S-Oil Corporation, Nynas AB, Ergon Inc., H&R Group, GS Caltex Corporation, Repsol S.A., Neste Oyj
Analyst Viewpoint:
There are structural changes occurring in the base oil market, which is shifting from traditional Group I base oils to Group II and Group III base oils because of the strict environmental regulations and the need for fuel efficiency in lubricants. The advent of automotive electric vehicles and downsizing of engines is driving lubricant companies to use low viscosity and highly pure base oils, thereby promoting the use of synthetic and semi-synthetic base oils. Group IV (PAOs) and Group V base oils are becoming popular in some specialized sectors, although the cost of production is an issue. Moreover, developing countries are continuing to maintain their demand for Group I base oils due to their lower price levels. There have been more investments in GTL and biobase oils for base oils. Nevertheless, the fluctuating crude oil prices and the excess capacity in some regions have posed difficulties in the market.
Base Oil Market Overview:
Base oil forms an important part in the manufacture of lubricating agents and constitutes about 70-90 percent of final products. Base oils can be derived through petroleum distillation or synthesized through chemistry, and classified into five categories (I-V) according to their sulfur, saturation, and viscosity indices under guidelines from the American Petroleum Institute.
Base oils of group I are refined using solvents and are classified as conventional, but groups II and III use techniques such as hydrorefining and hydrocracking which yield pure oils. The fourth category includes fully synthetic PAOs, and the fifth group entails specialty esters.
The global base oil industry was estimated to value around $US 43.7 billion in 2025 and will rise to over USD 66 billion by 2036 due to increasing demand for automotive and industrial lubricants due to increased vehicle manufacturing and industrial activities.
The manufacturing process utilizes solvent de-asphalting, catalytic dewaxing, and hydrocracking processes with the latest technology yielding high-quality and low sulfur oil. Base oils find application in the manufacture of automotive oils, industrial oils, hydraulics, metal cutting fluids, among others, where almost half is used in automotive applications.
Base oils of group I are refined using solvents and are classified as conventional, but groups II and III use techniques such as hydrorefining and hydrocracking which yield pure oils. The fourth category includes fully synthetic PAOs, and the fifth group entails specialty esters.
The global base oil industry was estimated to value around $US 43.7 billion in 2025 and will rise to over USD 66 billion by 2036 due to increasing demand for automotive and industrial lubricants due to increased vehicle manufacturing and industrial activities.
The manufacturing process utilizes solvent de-asphalting, catalytic dewaxing, and hydrocracking processes with the latest technology yielding high-quality and low sulfur oil. Base oils find application in the manufacture of automotive oils, industrial oils, hydraulics, metal cutting fluids, among others, where almost half is used in automotive applications.
| Drivers | Rising Demand for High-Performance Lubricants Driven by Stringent Emission and Fuel Efficiency Regulations |
| Growth in Automotive and Industrial Sectors Increasing Consumption of Base Oils Across Multiple Applications |
Rising Demand for High-Performance Lubricants Driven by Stringent Emission and Fuel Efficiency Regulations
Strict environmental standards and fuel efficiency standards are some of the driving forces behind the rise in demand for quality base oils, such as Group II base oil, Group III base oil, and synthetic base oil. Due to strict environmental and fuel efficiency standards, automotive companies produce fuel-efficient engines that need low viscosity lubricants that have higher thermal stability. From our perspective, the market for Group II base oil holds a significant share in the base oil market because of their better oxidation resistance properties and lower sulfur content levels.
Strict environmental norms such as Euro VI and others have been instrumental in the adoption of clean lubricants, thus forcing refineries to enhance their manufacturing plants for producing quality and clean base oils. Adoption of synthetic lubricants and PAO lubricants is also seen as an increasing trend in the base oil market. Adoption of strict environmental standards in the base oil market has contributed to rising consumption of quality base oils.
Strict environmental norms such as Euro VI and others have been instrumental in the adoption of clean lubricants, thus forcing refineries to enhance their manufacturing plants for producing quality and clean base oils. Adoption of synthetic lubricants and PAO lubricants is also seen as an increasing trend in the base oil market. Adoption of strict environmental standards in the base oil market has contributed to rising consumption of quality base oils.
Growth in Automotive and Industrial Sectors Increasing Consumption of Base Oils Across Multiple Applications
An increase in automotive and industrial demand will drive the growth of base oil consumption. Across the globe, growth in automotive demand and higher levels of mechanization in the construction, manufacturing, and energy generation industry will contribute to an increase in the consumption of lubricants. On its own, the automotive sector takes up a significant proportion of base oil consumption in areas like engine oils, transmission oils, and gear oils.
Another factor driving the demand for base oils involves the continued growth in the industrial sector in developing nations and other regions around the world, which will lead to an increase in base oil consumption in hydraulic systems, turbines, and metal processing. Also, the growth in infrastructure development and the use of heavy machinery will boost industrial lubricant consumption.
According to projections by experts, the global base oil market is expected to grow at a rate of approximately 3.8% during the forecast period between now and 2036.
Another factor driving the demand for base oils involves the continued growth in the industrial sector in developing nations and other regions around the world, which will lead to an increase in base oil consumption in hydraulic systems, turbines, and metal processing. Also, the growth in infrastructure development and the use of heavy machinery will boost industrial lubricant consumption.
According to projections by experts, the global base oil market is expected to grow at a rate of approximately 3.8% during the forecast period between now and 2036.
Base Oil Regional Market Outlook:
The market share of base oils in the Asia Pacific region stands at 40-45%, owing to the significant production of automobiles and rapid industrialization, along with increasing lubricants consumption in countries like China, India, and Southeast Asia.
Second place goes to North America, which holds around 20-22% market share, owing to the existence of highly efficient refining processes and the demand for synthetic base oils in the US.
Europe is another significant regional segment that is expected to hold around 18-20% market share, owing to environmental norms and high performance of base oils in the region.
Middle East & Africa is another significant market in base oils industry, which will account for around 8-10% market share owing to the presence of vast oil reserves in countries like Saudi Arabia and the UAE.
Second place goes to North America, which holds around 20-22% market share, owing to the existence of highly efficient refining processes and the demand for synthetic base oils in the US.
Europe is another significant regional segment that is expected to hold around 18-20% market share, owing to environmental norms and high performance of base oils in the region.
Middle East & Africa is another significant market in base oils industry, which will account for around 8-10% market share owing to the presence of vast oil reserves in countries like Saudi Arabia and the UAE.
Key Companies in Base Oil Market:
The base oil industry has moderate concentration. There is strong representation from major oil companies and refineries in the international base oil industry. Companies involved in this business have competitive strengths in their refining capabilities, products, and logistics. Hydrocracking, gas-to-liquids (GTL), and synthetic base oils represent some of the key areas where investments made by companies in the industry. In addition, sustainable base oils, including recycled and bio-based base oils, represent another focus area for these companies. Contractual agreements with lubricant manufacturers and original equipment manufacturers (OEMs) form an important source of competitive advantage.
Key participants include Shell plc, ExxonMobil Corporation, Chevron Corporation, BP plc, TotalEnergies SE, SK Lubricants Co. Ltd., ADNOC, Petronas Lubricants International, S-Oil Corporation, Nynas AB, Ergon Inc., H&R Group, GS Caltex Corporation, Repsol S.A., Neste Oyj and Others.
Key participants include Shell plc, ExxonMobil Corporation, Chevron Corporation, BP plc, TotalEnergies SE, SK Lubricants Co. Ltd., ADNOC, Petronas Lubricants International, S-Oil Corporation, Nynas AB, Ergon Inc., H&R Group, GS Caltex Corporation, Repsol S.A., Neste Oyj and Others.
Key Developments in Base Oil Market:
| 1. Shell launches upgraded Helix Ultra motor oil, meets 2025 API SQ Standard: In August 2025, Shell India introduced its upgraded premium motor oil, Shell Helix Ultra, now compliant with the advanced 2025 API SQ Standard. At the heart of the new Shell Helix Ultra is the company’s exclusive PurePlus Technology, which converts natural gas into a 99.5 per cent pure base oil. The formulation delivers measurable benefits, including up to 1.8 per cent more engine power, 3.4 per cent improved responsiveness, and 100 per cent engine power retention. |
| 2. ADNOC launches motor oils from 100% plant-derived base oils: In March 2022, ADNOC Distribution is launching a new Voyager Green Series range of lubricant products formulated with 100% plant-derived base oil. The product is available in UAE as well as in other 19 countries. |
Base Oil Market Attributes:
| ATTRIBUTE | DETAILS |
| Market Value, 2025 | $US 43.70 Billion |
| Forecasted Market Value, 2036 | $US 65.28 Billion |
| CAGR (2026-2036) | 3.8% |
| Analysis Period | 2021-2036 |
| Historic Period | 2021-2024 |
| Base Year | 2025 |
| Forecast Period | 2026-2036 |
| Volume Unit | Tons |
| Value Unit | $US Billion |
| Market Segmentation | By Group
By Application
By Region
|
| Companies Profiles |
|
| Customization Request | Available upon request |
1. Introduction
1.1. Report Scope
1.2. Market Segmentations and Definitions
1.3. Geographical Coverage
2. Executive Summary
2.1. Key Facts and Figures
2.2. Trends Impacting the Market
2.3. DatasticsR Growth Opportunity Matrix
3. Market Overview
3.1. Global Base Oil Market Analysis and Forecast, 2021-2036
3.1.1. Global Base Oil Market Size (Tons)
3.1.2. Global Base Oil Market Size ($US Bn)
3.2. Supply-side and Demand-side Trends
3.3. Technology Roadmap and Developments
3.4. Market Dynamics
3.4.1. Drivers
3.4.2. Restraints
3.4.3. Opportunities
3.5. Porter’s Five Forces Analysis
3.6. PESTL Analysis
3.7. Industry SWOT Analysis
3.8. Regulatory Landscape
3.9. Value Chain Analysis
3.9.1. List of Raw Material Suppliers
3.9.2. List of Manufacturing Companies
3.9.3. List of Dealers/Distributors
3.9.4. List of Potential Customers
3.10. Impact of Current Geopolitical Scenario on the Market
4. Technical Analysis
4.1. Product Specification Analysis
4.2. Details of Production Process
4.3. Technology Adoption and Emerging Technologies
4.4. R&D Trends and Patents Landscape
4.5. Cost Structure and Profitability Analysis
5. Global Production Analysis (Tons), by Region, 2025
5.1. North America
5.2. Europe
5.3. Asia Pacific
5.4. Latin America
5.5. Middle East and Africa
6. Import-export Analysis Volume (Tons) and Value ($US Bn), by Key Country, 2021-2025
7. Price Trend Analysis and Forecasting ($US/ Ton), 2021-2036
7.1. Price Trend Analysis and Forecasting, by Group
7.2. Price Trend Analysis and Forecasting, by Region
8. Global Base Oil Market Analysis and Forecasting (Tons) ($US Bn), by Group, 2021-2036
9. Global Base Oil Market Analysis and Forecasting (Tons) ($US Bn), by Application, 2021-2036
10. Global Base Oil Market Analysis and Forecasting (Tons) ($US Bn), by Region, 2021-2036
11. North America Base Oil Market Analysis and Forecasting (Tons) ($US Bn), by Group, 2021-2036
12. North America Base Oil Market Analysis and Forecasting (Tons) ($US Bn), by Application, 2021-2036
13. U.S. Base Oil Market Analysis and Forecasting (Tons) ($US Bn), by Group, 2021-2036
14. U.S. Base Oil Market Analysis and Forecasting (Tons) ($US Bn), by Application, 2021-2036
15. Canada Base Oil Market Analysis and Forecasting (Tons) ($US Bn), by Group, 2021-2036
16. Canada Base Oil Market Analysis and Forecasting (Tons) ($US Bn), by Application, 2021-2036
17. Europe Base Oil Market Analysis and Forecasting (Tons) ($US Bn), by Group, 2021-2036
18. Europe Base Oil Market Analysis and Forecasting (Tons) ($US Bn), by Application, 2021-2036
19. Germany Base Oil Market Analysis and Forecasting (Tons) ($US Bn), by Group, 2021-2036
20. Germany Base Oil Market Analysis and Forecasting (Tons) ($US Bn), by Application, 2021-2036
21. U.K. Base Oil Market Analysis and Forecasting (Tons) ($US Bn), by Group, 2021-2036
22. U.K. Base Oil Market Analysis and Forecasting (Tons) ($US Bn), by Application, 2021-2036
23. France Base Oil Market Analysis and Forecasting (Tons) ($US Bn), by Group, 2021-2036
24. France Base Oil Market Analysis and Forecasting (Tons) ($US Bn), by Application, 2021-2036
25. Italy Base Oil Market Analysis and Forecasting (Tons) ($US Bn), by Group, 2021-2036
26. Italy Base Oil Market Analysis and Forecasting (Tons) ($US Bn), by Application, 2021-2036
27. Spain Base Oil Market Analysis and Forecasting (Tons) ($US Bn), by Group, 2021-2036
28. Spain Base Oil Market Analysis and Forecasting (Tons) ($US Bn), by Application, 2021-2036
29. Russia & CIS Base Oil Market Analysis and Forecasting (Tons) ($US Bn), by Group, 2021-2036
30. Russia & CIS Base Oil Market Analysis and Forecasting (Tons) ($US Bn), by Application, 2021-2036
31. Rest of Europe Base Oil Market Analysis and Forecasting (Tons) ($US Bn), by Group, 2021-2036
32. Rest of Europe Base Oil Market Analysis and Forecasting (Tons) ($US Bn), by Application, 2021-2036
33. Asia Pacific Base Oil Market Analysis and Forecasting (Tons) ($US Bn), by Group, 2021-2036
34. Asia Pacific Base Oil Market Analysis and Forecasting (Tons) ($US Bn), by Application, 2021-2036
35. China Base Oil Market Analysis and Forecasting (Tons) ($US Bn), by Group, 2021-2036
36. China Base Oil Market Analysis and Forecasting (Tons) ($US Bn), by Application, 2021-2036
37. India Base Oil Market Analysis and Forecasting (Tons) ($US Bn), by Group, 2021-2036
38. India Base Oil Market Analysis and Forecasting (Tons) ($US Bn), by Application, 2021-2036
39. Japan Base Oil Market Analysis and Forecasting (Tons) ($US Bn), by Group, 2021-2036
40. Japan Base Oil Market Analysis and Forecasting (Tons) ($US Bn), by Application, 2021-2036
41. South Korea Base Oil Market Analysis and Forecasting (Tons) ($US Bn), by Group, 2021-2036
42. South Korea Base Oil Market Analysis and Forecasting (Tons) ($US Bn), by Application, 2021-2036
43. Taiwan Base Oil Market Analysis and Forecasting (Tons) ($US Bn), by Group, 2021-2036
44. Taiwan Base Oil Market Analysis and Forecasting (Tons) ($US Bn), by Application, 2021-2036
45. Australia Base Oil Market Analysis and Forecasting (Tons) ($US Bn), by Group, 2021-2036
46. Australia Base Oil Market Analysis and Forecasting (Tons) ($US Bn), by Application, 2021-2036
47. ASEAN Base Oil Market Analysis and Forecasting (Tons) ($US Bn), by Group, 2021-2036
48. ASEAN Base Oil Market Analysis and Forecasting (Tons) ($US Bn), by Application, 2021-2036
49. Rest of Asia Pacific Base Oil Market Analysis and Forecasting (Tons) ($US Bn), by Group, 2021-2036
50. Rest of Asia Pacific Base Oil Market Analysis and Forecasting (Tons) ($US Bn), by Application, 2021-2036
51. Latin America Base Oil Market Analysis and Forecasting (Tons) ($US Bn), by Group, 2021-2036
52. Latin America Base Oil Market Analysis and Forecasting (Tons) ($US Bn), by Application, 2021-2036
53. Brazil Base Oil Market Analysis and Forecasting (Tons) ($US Bn), by Group, 2021-2036
54. Brazil Base Oil Market Analysis and Forecasting (Tons) ($US Bn), by Application, 2021-2036
55. Mexico Base Oil Market Analysis and Forecasting (Tons) ($US Bn), by Group, 2021-2036
56. Mexico Base Oil Market Analysis and Forecasting (Tons) ($US Bn), by Application, 2021-2036
57. Argentina Base Oil Market Analysis and Forecasting (Tons) ($US Bn), by Group, 2021-2036
58. Argentina Base Oil Market Analysis and Forecasting (Tons) ($US Bn), by Application, 2021-2036
59. Rest of Latin America Base Oil Market Analysis and Forecasting (Tons) ($US Bn), by Group, 2021-2036
60. Rest of Latin America Base Oil Market Analysis and Forecasting (Tons) ($US Bn), by Application, 2021-2036
61. Middle East & Africa Base Oil Market Analysis and Forecasting (Tons) ($US Bn), by Group, 2021-2036
62. Middle East & Africa Base Oil Market Analysis and Forecasting (Tons) ($US Bn), by Application, 2021-2036
63. Saudi Arabia Base Oil Market Analysis and Forecasting (Tons) ($US Bn), by Group, 2021-2036
64. Saudi Arabia Base Oil Market Analysis and Forecasting (Tons) ($US Bn), by Application, 2021-2036
65. UAE Base Oil Market Analysis and Forecasting (Tons) ($US Bn), by Group, 2021-2036
66. UAE Base Oil Market Analysis and Forecasting (Tons) ($US Bn), by Application, 2021-2036
67. South Africa Base Oil Market Analysis and Forecasting (Tons) ($US Bn), by Group, 2021-2036
68. South Africa Base Oil Market Analysis and Forecasting (Tons) ($US Bn), by Application, 2021-2036
69. Rest of Middle East & Africa Base Oil Market Analysis and Forecasting (Tons) ($US Bn), by Group, 2021-2036
70. Rest of Middle East & Africa Base Oil Market Analysis and Forecasting (Tons) ($US Bn), by Application, 2021-2036
71. Competition Landscape
71.1. Market Share Analysis (%), by Company, 2025
71.2. Competitive Benchmarking
71.3. Company Profiles
71.3.1. Shell plc
71.3.1.1. Company Overview
71.3.1.2. Product Portfolio
71.3.1.3. Financials
71.3.1.4. Geographical Footprint
71.3.1.5. SWOT Analysis
71.3.1.6. Recent Developments and Strategies
71.3.2. ExxonMobil Corporation
71.3.2.1. Company Overview
71.3.2.2. Product Portfolio
71.3.2.3. Financials
71.3.2.4. Geographical Footprint
71.3.2.5. SWOT Analysis
71.3.2.6. Recent Developments and Strategies
71.3.3. Chevron Corporation
71.3.3.1. Company Overview
71.3.3.2. Product Portfolio
71.3.3.3. Financials
71.3.3.4. Geographical Footprint
71.3.3.5. SWOT Analysis
71.3.3.6. Recent Developments and Strategies
71.3.4. BP plc
71.3.4.1. Company Overview
71.3.4.2. Product Portfolio
71.3.4.3. Financials
71.3.4.4. Geographical Footprint
71.3.4.5. SWOT Analysis
71.3.4.6. Recent Developments and Strategies
71.3.5. TotalEnergies SE
71.3.5.1. Company Overview
71.3.5.2. Product Portfolio
71.3.5.3. Financials
71.3.5.4. Geographical Footprint
71.3.5.5. SWOT Analysis
71.3.5.6. Recent Developments and Strategies
71.3.6. SK Lubricants Co. Ltd.
71.3.6.1. Company Overview
71.3.6.2. Product Portfolio
71.3.6.3. Financials
71.3.6.4. Geographical Footprint
71.3.6.5. SWOT Analysis
71.3.6.6. Recent Developments and Strategies
71.3.7. ADNOC
71.3.7.1. Company Overview
71.3.7.2. Product Portfolio
71.3.7.3. Financials
71.3.7.4. Geographical Footprint
71.3.7.5. SWOT Analysis
71.3.7.6. Recent Developments and Strategies
71.3.8. Petronas Lubricants International
71.3.8.1. Company Overview
71.3.8.2. Product Portfolio
71.3.8.3. Financials
71.3.8.4. Geographical Footprint
71.3.8.5. SWOT Analysis
71.3.8.6. Recent Developments and Strategies
71.3.9. S-Oil Corporation
71.3.9.1. Company Overview
71.3.9.2. Product Portfolio
71.3.9.3. Financials
71.3.9.4. Geographical Footprint
71.3.9.5. SWOT Analysis
71.3.9.6. Recent Developments and Strategies
71.3.10. Nynas AB
71.3.10.1. Company Overview
71.3.10.2. Product Portfolio
71.3.10.3. Financials
71.3.10.4. Geographical Footprint
71.3.10.5. SWOT Analysis
71.3.10.6. Recent Developments and Strategies
71.3.11. Ergon Inc.
71.3.11.1. Company Overview
71.3.11.2. Product Portfolio
71.3.11.3. Financials
71.3.11.4. Geographical Footprint
71.3.11.5. SWOT Analysis
71.3.11.6. Recent Developments and Strategies
71.3.12. H&R Group
71.3.12.1. Company Overview
71.3.12.2. Product Portfolio
71.3.12.3. Financials
71.3.12.4. Geographical Footprint
71.3.12.5. SWOT Analysis
71.3.12.6. Recent Developments and Strategies
71.3.13. GS Caltex Corporation
71.3.13.1. Company Overview
71.3.13.2. Product Portfolio
71.3.13.3. Financials
71.3.13.4. Geographical Footprint
71.3.13.5. SWOT Analysis
71.3.13.6. Recent Developments and Strategies
71.3.14. Repsol S.A.
71.3.14.1. Company Overview
71.3.14.2. Product Portfolio
71.3.14.3. Financials
71.3.14.4. Geographical Footprint
71.3.14.5. SWOT Analysis
71.3.14.6. Recent Developments and Strategies
71.3.15. Neste Oyj
71.3.15.1. Company Overview
71.3.15.2. Product Portfolio
71.3.15.3. Financials
71.3.15.4. Geographical Footprint
71.3.15.5. SWOT Analysis
71.3.15.6. Recent Developments and Strategies
71.3.16. Others
72. Appendix
- Get Started -
Get insights that lead to new growth opportunities
- Talk to Experts -
Get answers to your queries on this report from our experts
Frequently Asked Questions
The global Base Oil market in 2025 was $US 43.70 Billion.
The global Base Oil market will be $US 65.28 Billion by 2036.
The expected growth rate (CAGR%) of the global Base Oil market is 3.8% for the period 2026-2036.
Rising Demand for High-Performance Lubricants Driven by Stringent Emission and Fuel Efficiency Regulations and Growth in Automotive and Industrial Sectors Increasing Consumption of Base Oils Across Multiple Applications.
Group II Base Oil was the largest segment holding around 27.4% share among all in Base Oil Market in 2025.
Asia Pacific was the leading regions for Base Oil holding around 43.5% of the global market in 2025.
Shell plc, ExxonMobil Corporation, Chevron Corporation, BP plc, TotalEnergies SE, SK Lubricants Co. Ltd., ADNOC, Petronas Lubricants International, S-Oil Corporation, Nynas AB, Ergon Inc., H&R Group, GS Caltex Corporation, Repsol S.A., Neste Oyj and Others.