

Carbon-to-Specialty Chemicals Market
Carbon-to-Specialty Chemicals Market (Technology: Thermochemical Conversion, Gas Fermentation, CO2 Electrolysis, Mineralization and Others; Product Type: Methanol & Derivatives, Ethanol & Alcohols, Olefins & Polymers, Sustainable Aviation Fuel (SAF), Formic Acid, Acetic Acid and Others; and End-use Industry: Plastics & Packaging, Aviation & Transportation Fuels, Textiles, Pharmaceuticals, Food Additives, Construction Materials and Others) – Global Industry Analysis, Shares, Growth, Trends and Forecast 2021-2036
Categories:
All, Chemicals and Materials
| Format: PDF/PPT/Excel
| Product ID:
4902
| Report Version:
October 2026
- Report Preview
- Table of Content
- Request Customization
Market Snappshot
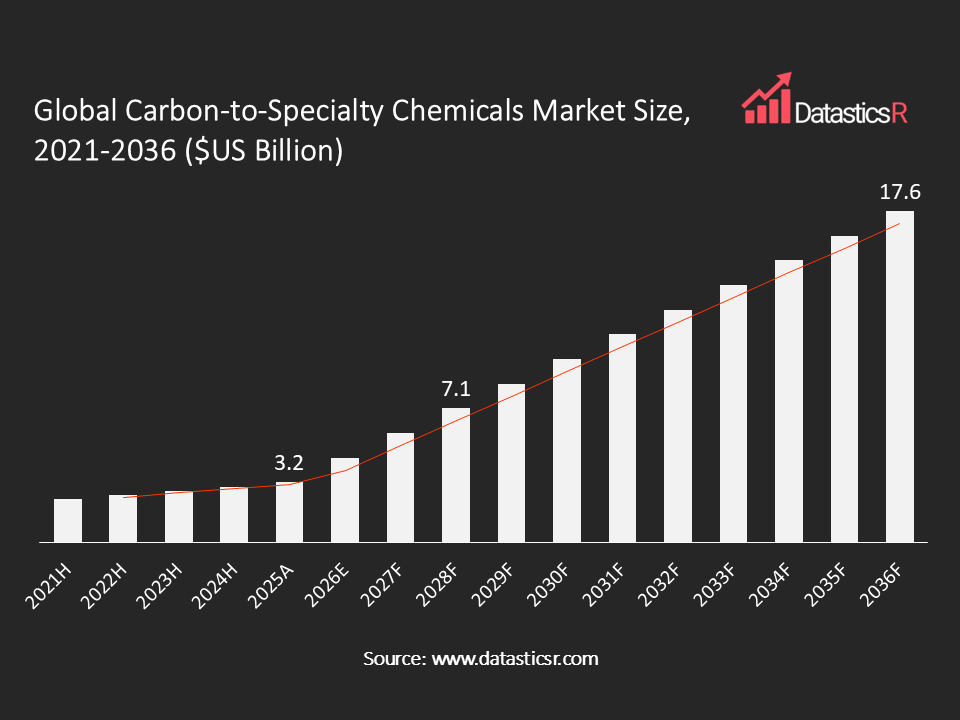
- Market Size in 2025: $US 3.2 Bn
- Forecast Market by 2036: $US 17.6 Bn
- CAGR for the Period 2026-2036: 14.6%
- Top Region in Terms of Market Share: Asia Pacific (24%)
- Key Players: LanzaTech Global Inc., Twelve Benefit Corporation, Dioxycle, Mitsubishi Gas Chemical Company, Perstorp Holding AB, Uniper SE, Toyo Engineering Corporation, OCOchem, and Others
Analyst Viewpoint:
The easiest way to understand the carbon-to-specialty chemicals market is to see it as a raw-material swap. Buyers want the same methanol, ethanol or plastic they use today, but made from captured CO2 instead of oil and gas. They will buy it when the product has the same quality, meets the rules or targets they follow, and costs only a little more. If any one of those three is missing, projects slow down. Cost is the biggest hurdle. Most CO2-to-chemicals routes need a lot of green hydrogen and clean power, so the price of renewable electricity matters more than the price of capturing CO2. Routes that use industrial waste gas or bio-based carbon need less hydrogen. These routes are likely to be built first, especially in places where clean power is cheap. The growth rate looks very high because the market is still small. A market that is moving from a few pilot plants to its first commercial plants can grow more than 25% a year for a while, and then it slows down as it gets bigger. The key thing to watch is who signs long-term purchase deals. Once industrial and consumer brands sign these deals instead of governments, the market can stand on its own.
Carbon-to-Specialty Chemicals Market Overview:
The carbon-to-specialty chemicals market comprises technologies that convert captured carbon dioxide, industrial off-gas, or biogenic carbon into chemical intermediates and specialty products, including methanol, ethanol, olefins, organic acids, and sustainable fuel precursors, in place of conventional fossil-derived feedstocks. The products serve industries ranging from plastics and packaging to aviation fuel, construction materials, and pharmaceuticals.
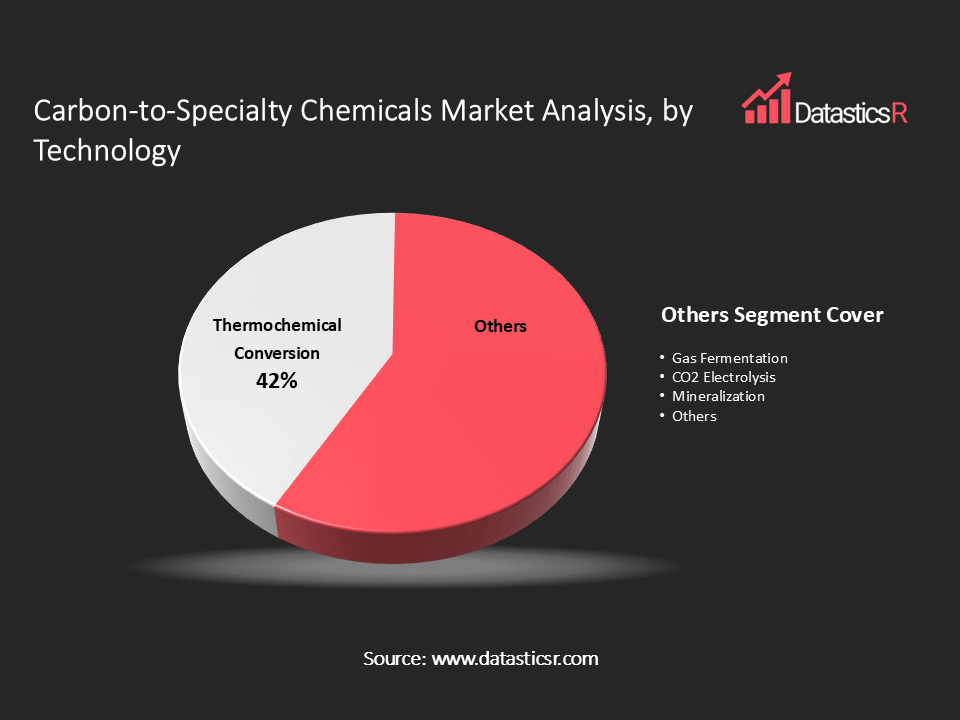
By technology, thermochemical conversion leads with a 42% share in 2025, owing to the maturity of methanol and Fischer-Tropsch style synthesis, while CO2 electrolysis is the fastest-growing pathway as electrochemical systems move from pilot to first commercial offtake. By product, methanol & derivatives leads with a 28% share, while sustainable aviation fuel & fuel precursors is the fastest-growing product category as ethanol-to-jet and methanol-to-jet routes reach commercial scale. By end-use industry, plastics & packaging leads the market, while aviation & transportation fuels is the fastest-growing end-use as fuel blending mandates widen. By region, Asia Pacific leads with a 38% share and is also the fastest-growing region, followed by North America at 30% and Europe at 24%.
The defining trend across this market is the move from grant-funded demonstration plants toward commercial, revenue-generating offtake agreements, both with heavy industry hosting the carbon source and with downstream brand owners seeking lower-carbon inputs.
By technology, thermochemical conversion leads with a 42% share in 2025, owing to the maturity of methanol and Fischer-Tropsch style synthesis, while CO2 electrolysis is the fastest-growing pathway as electrochemical systems move from pilot to first commercial offtake. By product, methanol & derivatives leads with a 28% share, while sustainable aviation fuel & fuel precursors is the fastest-growing product category as ethanol-to-jet and methanol-to-jet routes reach commercial scale. By end-use industry, plastics & packaging leads the market, while aviation & transportation fuels is the fastest-growing end-use as fuel blending mandates widen. By region, Asia Pacific leads with a 38% share and is also the fastest-growing region, followed by North America at 30% and Europe at 24%.
The defining trend across this market is the move from grant-funded demonstration plants toward commercial, revenue-generating offtake agreements, both with heavy industry hosting the carbon source and with downstream brand owners seeking lower-carbon inputs.
| Drivers | Industrial Decarbonization Policy and Public Funding Across Europe, Asia, and North America |
| Rising Demand for Lower-Carbon Fuels and Materials from Aviation, Packaging, and Chemical Buyers Worldwide |
Industrial Decarbonization Policy and Public Funding Across Europe, Asia, and North America
Government support is the main reason CO2-to-chemicals projects are reaching commercial size, and it is happening on three continents at the same time. In Europe, the EU Innovation Fund signed a EUR 97 million grant in January 2023 for Project Air. This is a large sustainable methanol plant developed by Perstorp and Uniper. It uses captured CO2, residue streams, renewable hydrogen and biomethane. The EU-funded THREADING-CO2 project is also aiming for a pilot plant that turns one tonne of CO2 into ethylene per day. In addition, the EU plans to stop treating fossil-based CO2 as an eligible raw material by 2035 for power plants and by 2040 for other sources. This pushes producers toward bio-based and industrial waste carbon.
In Asia, Toyo Engineering started up a 10-tonne-per-day green methanol plant at NTPC’s Vindhyachal power station in Madhya Pradesh, India. Production began on June 3, 2025. The plant uses CO2 captured from flue gas together with green hydrogen. In Japan, Mitsubishi Gas Chemical and JFE Steel plan a 100-tonne-per-year pilot at Mizushima that makes methanol from steelmaking gas. The pilot is due to start in fiscal 2026, and MGC is also studying a green methanol plant of about 1 million tonnes per year after fiscal 2030. In North America, the US Department of Energy has funded carbon utilization work, including an award to LanzaTech to turn waste CO2 into chemicals such as isopropanol.
Each region supports the market in a different way. Europe relies on grants and carbon rules, Asia on state-backed power companies and heavy industry, and North America on federal research funding. Because of this, the market does not depend on any single country’s policy.
In Asia, Toyo Engineering started up a 10-tonne-per-day green methanol plant at NTPC’s Vindhyachal power station in Madhya Pradesh, India. Production began on June 3, 2025. The plant uses CO2 captured from flue gas together with green hydrogen. In Japan, Mitsubishi Gas Chemical and JFE Steel plan a 100-tonne-per-year pilot at Mizushima that makes methanol from steelmaking gas. The pilot is due to start in fiscal 2026, and MGC is also studying a green methanol plant of about 1 million tonnes per year after fiscal 2030. In North America, the US Department of Energy has funded carbon utilization work, including an award to LanzaTech to turn waste CO2 into chemicals such as isopropanol.
Each region supports the market in a different way. Europe relies on grants and carbon rules, Asia on state-backed power companies and heavy industry, and North America on federal research funding. Because of this, the market does not depend on any single country’s policy.
Rising Demand for Lower-Carbon Fuels and Materials from Aviation, Packaging, and Chemical Buyers Worldwide
The second driver is demand from buyers. Airlines and fuel makers in several countries must blend more sustainable aviation fuel (SAF), so they want raw materials with a lower carbon footprint. Ethanol and methanol made from industrial emissions can be turned into jet fuel using proven methods. This is why sustainable aviation fuel & fuel precursors is the fastest-growing product, and aviation & transportation fuels is the fastest-growing end-use.
Packaging and consumer brands are a newer source of demand. In March 2026, Dioxycle signed a multi-year, take-or-pay supply agreement with L’Oréal for CO2-based high-density polyethylene (HDPE) to be used in product packaging. It is one of the first direct deals of this kind with a large consumer brand. The shortlist for the CO2 Value Europe innovation award, announced in March 2026, also shows how wide the range of products has become. The nominees come from France, Germany, Italy and the United States, and they make e-methanol, ethylene, specialty isocyanates, formic acid and isopropyl alcohol.
This demand helps plastics & packaging stay the largest end-use and opens new markets beyond fuels. It is spread across the world. Fuel blending rules and brand targets are being set in Europe and North America, while much of the new production capacity is being built in Asia.
Packaging and consumer brands are a newer source of demand. In March 2026, Dioxycle signed a multi-year, take-or-pay supply agreement with L’Oréal for CO2-based high-density polyethylene (HDPE) to be used in product packaging. It is one of the first direct deals of this kind with a large consumer brand. The shortlist for the CO2 Value Europe innovation award, announced in March 2026, also shows how wide the range of products has become. The nominees come from France, Germany, Italy and the United States, and they make e-methanol, ethylene, specialty isocyanates, formic acid and isopropyl alcohol.
This demand helps plastics & packaging stay the largest end-use and opens new markets beyond fuels. It is spread across the world. Fuel blending rules and brand targets are being set in Europe and North America, while much of the new production capacity is being built in Asia.
Carbon-to-Specialty Chemicals Regional Market Outlook:
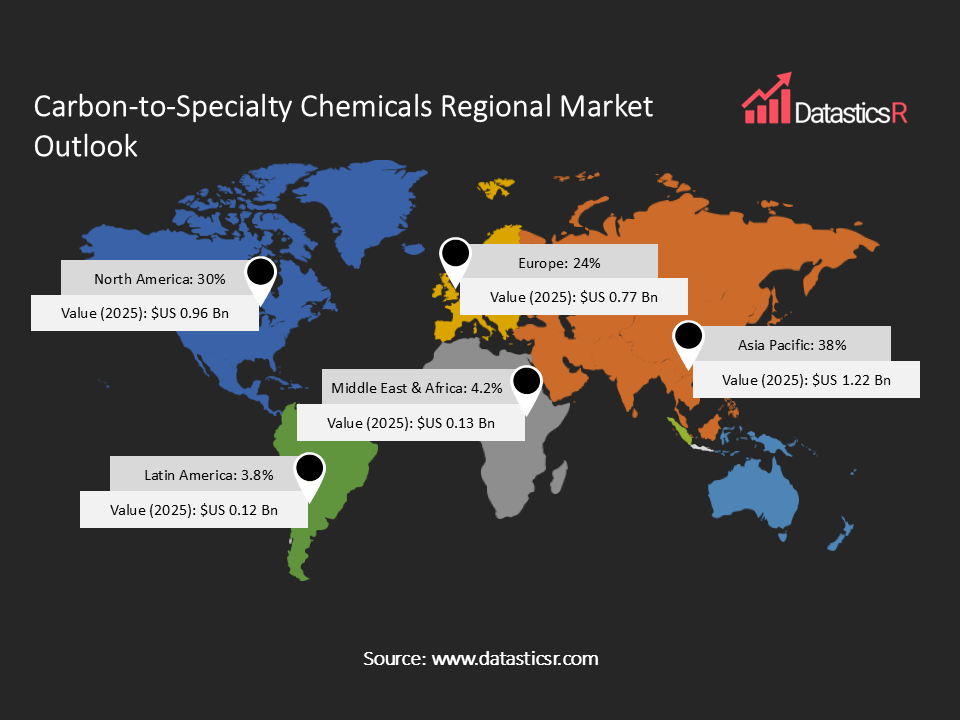
Asia Pacific is the largest and fastest-growing region, with about 38% of the market. Growth comes from large state-backed decarbonization programs, commercial gas fermentation plants in China, new CO2-to-methanol capacity in India, and pilot projects by Japanese chemical and steel companies.
North America holds about 30% of the market. It benefits from federal carbon management funding, many CO2 electrolysis and gas fermentation technology companies, and rising demand for sustainable aviation fuel.
Europe holds about 24% of the market. EU Innovation Fund grants, carbon utilization research programs and a policy that favors bio-based and waste carbon all support growth.
Latin America and the Middle East & Africa each hold about 4% of the market. Interest is still at an early stage and is linked to energy transition and petrochemical diversification plans.
North America holds about 30% of the market. It benefits from federal carbon management funding, many CO2 electrolysis and gas fermentation technology companies, and rising demand for sustainable aviation fuel.
Europe holds about 24% of the market. EU Innovation Fund grants, carbon utilization research programs and a policy that favors bio-based and waste carbon all support growth.
Latin America and the Middle East & Africa each hold about 4% of the market. Interest is still at an early stage and is linked to energy transition and petrochemical diversification plans.
Key Companies in Carbon-to-Specialty Chemicals Market:
The market includes technology developers, established chemical producers, and engineering and energy partners. This is because there are several different ways to turn CO2 into chemicals. LanzaTech Global is a leader in gas fermentation and runs commercial plants in several countries. Twelve Benefit Corporation and Dioxycle are leaders in CO2 electrolysis. OCOchem, RenewCO2 and Fairbrics work on electrolysis routes to formic acid, glycol and textile fibers. Large chemical companies such as Mitsubishi Gas Chemical and Perstorp bring methanol production experience. Uniper adds energy sector expertise, and Toyo Engineering supplies its own CO2-to-methanol process technology. Carbon Clean Solutions, Air Company, Novoloop and Prometheus Fuels cover carbon capture, fuels and materials.
Key players include LanzaTech Global Inc., Twelve Benefit Corporation, Dioxycle, Mitsubishi Gas Chemical Company, Perstorp Holding AB, Uniper SE, Toyo Engineering Corporation, OCOchem, Carbon Clean Solutions, Air Company and Others.
Key players include LanzaTech Global Inc., Twelve Benefit Corporation, Dioxycle, Mitsubishi Gas Chemical Company, Perstorp Holding AB, Uniper SE, Toyo Engineering Corporation, OCOchem, Carbon Clean Solutions, Air Company and Others.
Key Developments in Carbon-to-Specialty Chemicals Market:
| 1. Beijing Shougang LanzaTech Lists in Hong Kong: On June 3, 2026, the carbon recycling joint venture completed its IPO on the Hong Kong Stock Exchange. It raised about $75 million at a market value of about $750 million. |
| 2. Dioxycle Signs CO2-Based HDPE Supply Deal with L’Oréal: In March 2026, Dioxycle agreed to supply low-carbon polyethylene, made using CO2 electrolysis, for L’Oréal product packaging under a multi-year, take-or-pay contract. |
Carbon-to-Specialty Chemicals Market Attributes:
| Market Value, 2025 | $US 3.2 Billion |
| Forecasted Market Value, 2036 | $US 17.6 Billion |
| CAGR (2026-2036) | 14.6% |
| Analysis Period | 2021-2036 |
| Historic Period | 2021-2024 |
| Base Year | 2025 |
| Forecast Period | 2026-2036 |
| Volume Unit | Tons |
| Value Unit | $US Billion |
| Market Segmentation | By Conversion Pathway
By Product
By End-use Industry
By Region
|
| Companies Profiles |
|
| Customization Request | Available upon request |
1. Introduction
1.1. Report Scope
1.2. Market Segmentations and Definitions
1.3. Geographical Coverage
2. Executive Summary
2.1. Key Facts and Figures
2.2. Trends Impacting the Market
2.3. DatasticsR Growth Opportunity Matrix
3. Market Overview
3.1. Global Carbon-to-Specialty Chemicals Market Analysis and Forecast, 2021-2036
3.1.1. Global Carbon-to-Specialty Chemicals Market Size (Tons)
3.1.2. Global Carbon-to-Specialty Chemicals Market Size ($US Bn)
3.2. Key Market Trends
3.3. Technology Roadmap and Developments
3.4. Market Dynamics
3.4.1. Drivers
3.4.2. Restraints
3.4.3. Opportunities
3.5. Porter’s Five Forces Analysis
3.6. PESTL Analysis
3.7. Industry SWOT Analysis
3.8. Regulatory Landscape
3.9. Value Chain Analysis
3.9.1. List of Materials Suppliers
3.9.2. List of Manufacturers
3.9.3. List of Dealers / Distributors
3.9.4. List of Potential Customers
3.10. Impact of Current Geopolitical Scenario on the Market
4. Technical Analysis
4.1. Product Specifications Analysis
4.2. Technology Adoption and Emerging Technologies
4.3. R&D Trends and Patents Landscape
4.4. Cost Structure and Profitability Analysis
5. Global Production Output Analysis (Tons), by Region, 2025
5.1. North America
5.2. Europe
5.3. Asia Pacific
5.4. Latin America
5.5. Middle East and Africa
6. Import-export Analysis Volume (Tons) and Value ($US Bn), by Key Country, 2021-2025
7. Price Trend Analysis and Forecasting ($US/Ton), 2021-2036
7.1. Price Trend Analysis and Forecasting, by Product Type
7.2. Price Trend Analysis and Forecasting, by Region
8. Global Carbon-to-Specialty Chemicals Market Analysis and Forecasting (Tons) ($US Bn), by Technology, 2021-2036
9. Global Carbon-to-Specialty Chemicals Market Analysis and Forecasting (Tons) ($US Bn), by Product Type, 2021-2036
10. Global Carbon-to-Specialty Chemicals Market Analysis and Forecasting (Tons) ($US Bn), by End-use Industry, 2021-2036
11. Global Carbon-to-Specialty Chemicals Market Analysis and Forecasting (Tons) ($US Bn), by Region, 2021-2036
12. North America Carbon-to-Specialty Chemicals Market Analysis and Forecasting (Tons) ($US Bn), by Technology, 2021-2036
13. North America Carbon-to-Specialty Chemicals Market Analysis and Forecasting (Tons) ($US Bn), by Product Type, 2021-2036
14. North America Carbon-to-Specialty Chemicals Market Analysis and Forecasting (Tons) ($US Bn), by End-use Industry, 2021-2036
15. U.S. Carbon-to-Specialty Chemicals Market Analysis and Forecasting (Tons) ($US Bn), by Technology, 2021-2036
16. U.S. Carbon-to-Specialty Chemicals Market Analysis and Forecasting (Tons) ($US Bn), by Product Type, 2021-2036
17. U.S. Carbon-to-Specialty Chemicals Market Analysis and Forecasting (Tons) ($US Bn), by End-use Industry, 2021-2036
18. Canada Carbon-to-Specialty Chemicals Market Analysis and Forecasting (Tons) ($US Bn), by Technology, 2021-2036
19. Canada Carbon-to-Specialty Chemicals Market Analysis and Forecasting (Tons) ($US Bn), by Product Type, 2021-2036
20. Canada Carbon-to-Specialty Chemicals Market Analysis and Forecasting (Tons) ($US Bn), by End-use Industry, 2021-2036
21. Europe Carbon-to-Specialty Chemicals Market Analysis and Forecasting (Tons) ($US Bn), by Technology, 2021-2036
22. Europe Carbon-to-Specialty Chemicals Market Analysis and Forecasting (Tons) ($US Bn), by Product Type, 2021-2036
23. Europe Carbon-to-Specialty Chemicals Market Analysis and Forecasting (Tons) ($US Bn), by End-use Industry, 2021-2036
24. Germany Carbon-to-Specialty Chemicals Market Analysis and Forecasting (Tons) ($US Bn), by Technology, 2021-2036
25. Germany Carbon-to-Specialty Chemicals Market Analysis and Forecasting (Tons) ($US Bn), by Product Type, 2021-2036
26. Germany Carbon-to-Specialty Chemicals Market Analysis and Forecasting (Tons) ($US Bn), by End-use Industry, 2021-2036
27. U.K. Carbon-to-Specialty Chemicals Market Analysis and Forecasting (Tons) ($US Bn), by Technology, 2021-2036
28. U.K. Carbon-to-Specialty Chemicals Market Analysis and Forecasting (Tons) ($US Bn), by Product Type, 2021-2036
29. U.K. Carbon-to-Specialty Chemicals Market Analysis and Forecasting (Tons) ($US Bn), by End-use Industry, 2021-2036
30. France Carbon-to-Specialty Chemicals Market Analysis and Forecasting (Tons) ($US Bn), by Technology, 2021-2036
31. France Carbon-to-Specialty Chemicals Market Analysis and Forecasting (Tons) ($US Bn), by Product Type, 2021-2036
32. France Carbon-to-Specialty Chemicals Market Analysis and Forecasting (Tons) ($US Bn), by End-use Industry, 2021-2036
33. Italy Carbon-to-Specialty Chemicals Market Analysis and Forecasting (Tons) ($US Bn), by Technology, 2021-2036
34. Italy Carbon-to-Specialty Chemicals Market Analysis and Forecasting (Tons) ($US Bn), by Product Type, 2021-2036
35. Italy Carbon-to-Specialty Chemicals Market Analysis and Forecasting (Tons) ($US Bn), by End-use Industry, 2021-2036
36. Spain Carbon-to-Specialty Chemicals Market Analysis and Forecasting (Tons) ($US Bn), by Technology, 2021-2036
37. Spain Carbon-to-Specialty Chemicals Market Analysis and Forecasting (Tons) ($US Bn), by Product Type, 2021-2036
38. Spain Carbon-to-Specialty Chemicals Market Analysis and Forecasting (Tons) ($US Bn), by End-use Industry, 2021-2036
39. Russia & CIS Carbon-to-Specialty Chemicals Market Analysis and Forecasting (Tons) ($US Bn), by Technology, 2021-2036
40. Russia & CIS Carbon-to-Specialty Chemicals Market Analysis and Forecasting (Tons) ($US Bn), by Product Type, 2021-2036
41. Russia & CIS Carbon-to-Specialty Chemicals Market Analysis and Forecasting (Tons) ($US Bn), by End-use Industry, 2021-2036
42. Rest of Europe Carbon-to-Specialty Chemicals Market Analysis and Forecasting (Tons) ($US Bn), by Technology, 2021-2036
43. Rest of Europe Carbon-to-Specialty Chemicals Market Analysis and Forecasting (Tons) ($US Bn), by Product Type, 2021-2036
44. Rest of Europe Carbon-to-Specialty Chemicals Market Analysis and Forecasting (Tons) ($US Bn), by End-use Industry, 2021-2036
45. Asia Pacific Carbon-to-Specialty Chemicals Market Analysis and Forecasting (Tons) ($US Bn), by Technology, 2021-2036
46. Asia Pacific Carbon-to-Specialty Chemicals Market Analysis and Forecasting (Tons) ($US Bn), by Product Type, 2021-2036
47. Asia Pacific Carbon-to-Specialty Chemicals Market Analysis and Forecasting (Tons) ($US Bn), by End-use Industry, 2021-2036
48. China Carbon-to-Specialty Chemicals Market Analysis and Forecasting (Tons) ($US Bn), by Technology, 2021-2036
49. China Carbon-to-Specialty Chemicals Market Analysis and Forecasting (Tons) ($US Bn), by Product Type, 2021-2036
50. China Carbon-to-Specialty Chemicals Market Analysis and Forecasting (Tons) ($US Bn), by End-use Industry, 2021-2036
51. India Carbon-to-Specialty Chemicals Market Analysis and Forecasting (Tons) ($US Bn), by Technology, 2021-2036
52. India Carbon-to-Specialty Chemicals Market Analysis and Forecasting (Tons) ($US Bn), by Product Type, 2021-2036
53. India Carbon-to-Specialty Chemicals Market Analysis and Forecasting (Tons) ($US Bn), by End-use Industry, 2021-2036
54. Japan Carbon-to-Specialty Chemicals Market Analysis and Forecasting (Tons) ($US Bn), by Technology, 2021-2036
55. Japan Carbon-to-Specialty Chemicals Market Analysis and Forecasting (Tons) ($US Bn), by Product Type, 2021-2036
56. Japan Carbon-to-Specialty Chemicals Market Analysis and Forecasting (Tons) ($US Bn), by End-use Industry, 2021-2036
57. South Korea Carbon-to-Specialty Chemicals Market Analysis and Forecasting (Tons) ($US Bn), by Technology, 2021-2036
58. South Korea Carbon-to-Specialty Chemicals Market Analysis and Forecasting (Tons) ($US Bn), by Product Type, 2021-2036
59. South Korea Carbon-to-Specialty Chemicals Market Analysis and Forecasting (Tons) ($US Bn), by End-use Industry, 2021-2036
60. Taiwan Carbon-to-Specialty Chemicals Market Analysis and Forecasting (Tons) ($US Bn), by Technology, 2021-2036
61. Taiwan Carbon-to-Specialty Chemicals Market Analysis and Forecasting (Tons) ($US Bn), by Product Type, 2021-2036
62. Taiwan Carbon-to-Specialty Chemicals Market Analysis and Forecasting (Tons) ($US Bn), by End-use Industry, 2021-2036
63. Australia Carbon-to-Specialty Chemicals Market Analysis and Forecasting (Tons) ($US Bn), by Technology, 2021-2036
64. Australia Carbon-to-Specialty Chemicals Market Analysis and Forecasting (Tons) ($US Bn), by Product Type, 2021-2036
65. Australia Carbon-to-Specialty Chemicals Market Analysis and Forecasting (Tons) ($US Bn), by End-use Industry, 2021-2036
66. ASEAN Carbon-to-Specialty Chemicals Market Analysis and Forecasting (Tons) ($US Bn), by Technology, 2021-2036
67. ASEAN Carbon-to-Specialty Chemicals Market Analysis and Forecasting (Tons) ($US Bn), by Product Type, 2021-2036
68. ASEAN Carbon-to-Specialty Chemicals Market Analysis and Forecasting (Tons) ($US Bn), by End-use Industry, 2021-2036
69. Rest of Asia Pacific Carbon-to-Specialty Chemicals Market Analysis and Forecasting (Tons) ($US Bn), by Technology, 2021-2036
70. Rest of Asia Pacific Carbon-to-Specialty Chemicals Market Analysis and Forecasting (Tons) ($US Bn), by Product Type, 2021-2036
71. Rest of Asia Pacific Carbon-to-Specialty Chemicals Market Analysis and Forecasting (Tons) ($US Bn), by End-use Industry, 2021-2036
72. Latin America Carbon-to-Specialty Chemicals Market Analysis and Forecasting (Tons) ($US Bn), by Technology, 2021-2036
73. Latin America Carbon-to-Specialty Chemicals Market Analysis and Forecasting (Tons) ($US Bn), by Product Type, 2021-2036
74. Latin America Carbon-to-Specialty Chemicals Market Analysis and Forecasting (Tons) ($US Bn), by End-use Industry, 2021-2036
75. Brazil Carbon-to-Specialty Chemicals Market Analysis and Forecasting (Tons) ($US Bn), by Technology, 2021-2036
76. Brazil Carbon-to-Specialty Chemicals Market Analysis and Forecasting (Tons) ($US Bn), by Product Type, 2021-2036
77. Brazil Carbon-to-Specialty Chemicals Market Analysis and Forecasting (Tons) ($US Bn), by End-use Industry, 2021-2036
78. Mexico Carbon-to-Specialty Chemicals Market Analysis and Forecasting (Tons) ($US Bn), by Technology, 2021-2036
79. Mexico Carbon-to-Specialty Chemicals Market Analysis and Forecasting (Tons) ($US Bn), by Product Type, 2021-2036
80. Mexico Carbon-to-Specialty Chemicals Market Analysis and Forecasting (Tons) ($US Bn), by End-use Industry, 2021-2036
81. Argentina Carbon-to-Specialty Chemicals Market Analysis and Forecasting (Tons) ($US Bn), by Technology, 2021-2036
82. Argentina Carbon-to-Specialty Chemicals Market Analysis and Forecasting (Tons) ($US Bn), by Product Type, 2021-2036
83. Argentina Carbon-to-Specialty Chemicals Market Analysis and Forecasting (Tons) ($US Bn), by End-use Industry, 2021-2036
84. Rest of Latin America Carbon-to-Specialty Chemicals Market Analysis and Forecasting (Tons) ($US Bn), by Technology, 2021-2036
85. Rest of Latin America Carbon-to-Specialty Chemicals Market Analysis and Forecasting (Tons) ($US Bn), by Product Type, 2021-2036
86. Rest of Latin America Carbon-to-Specialty Chemicals Market Analysis and Forecasting (Tons) ($US Bn), by End-use Industry, 2021-2036
87. Middle East & Africa Carbon-to-Specialty Chemicals Market Analysis and Forecasting (Tons) ($US Bn), by Technology, 2021-2036
88. Middle East & Africa Carbon-to-Specialty Chemicals Market Analysis and Forecasting (Tons) ($US Bn), by Product Type, 2021-2036
89. Middle East & Africa Carbon-to-Specialty Chemicals Market Analysis and Forecasting (Tons) ($US Bn), by End-use Industry, 2021-2036
90. Saudi Arabia Carbon-to-Specialty Chemicals Market Analysis and Forecasting (Tons) ($US Bn), by Technology, 2021-2036
91. Saudi Arabia Carbon-to-Specialty Chemicals Market Analysis and Forecasting (Tons) ($US Bn), by Product Type, 2021-2036
92. Saudi Arabia Carbon-to-Specialty Chemicals Market Analysis and Forecasting (Tons) ($US Bn), by End-use Industry, 2021-2036
93. UAE Carbon-to-Specialty Chemicals Market Analysis and Forecasting (Tons) ($US Bn), by Technology, 2021-2036
94. UAE Carbon-to-Specialty Chemicals Market Analysis and Forecasting (Tons) ($US Bn), by Product Type, 2021-2036
95. UAE Carbon-to-Specialty Chemicals Market Analysis and Forecasting (Tons) ($US Bn), by End-use Industry, 2021-2036
96. South Africa Carbon-to-Specialty Chemicals Market Analysis and Forecasting (Tons) ($US Bn), by Technology, 2021-2036
97. South Africa Carbon-to-Specialty Chemicals Market Analysis and Forecasting (Tons) ($US Bn), by Product Type, 2021-2036
98. South Africa Carbon-to-Specialty Chemicals Market Analysis and Forecasting (Tons) ($US Bn), by End-use Industry, 2021-2036
99. Rest of Middle East & Africa Carbon-to-Specialty Chemicals Market Analysis and Forecasting (Tons) ($US Bn), by Technology, 2021-2036
100. Rest of Middle East & Africa Carbon-to-Specialty Chemicals Market Analysis and Forecasting (Tons) ($US Bn), by Product Type, 2021-2036
101. Rest of Middle East & Africa Carbon-to-Specialty Chemicals Market Analysis and Forecasting (Tons) ($US Bn), by End-use Industry, 2021-2036
102. Competition Landscape
102.1. Market Share Analysis (%), by Company, 2025
102.2. Competitive Benchmarking
102.3. Company Profiles
102.3.1. LanzaTech Global Inc.
102.3.1.1. Company Overview
102.3.1.2. Business Portfolio
102.3.1.3. Financials
102.3.1.4. Geographical Footprint
102.3.1.5. SWOT Analysis
102.3.1.6. Recent Developments and Strategies
102.3.2. Twelve Benefit Corporation
102.3.2.1. Company Overview
102.3.2.2. Business Portfolio
102.3.2.3. Financials
102.3.2.4. Geographical Footprint
102.3.2.5. SWOT Analysis
102.3.2.6. Recent Developments and Strategies
102.3.3. Dioxycle
102.3.3.1. Company Overview
102.3.3.2. Business Portfolio
102.3.3.3. Financials
102.3.3.4. Geographical Footprint
102.3.3.5. SWOT Analysis
102.3.3.6. Recent Developments and Strategies
102.3.4. Mitsubishi Gas Chemical Company
102.3.4.1. Company Overview
102.3.4.2. Business Portfolio
102.3.4.3. Financials
102.3.4.4. Geographical Footprint
102.3.4.5. SWOT Analysis
102.3.4.6. Recent Developments and Strategies
102.3.5. Perstorp Holding AB
102.3.5.1. Company Overview
102.3.5.2. Business Portfolio
102.3.5.3. Financials
102.3.5.4. Geographical Footprint
102.3.5.5. SWOT Analysis
102.3.5.6. Recent Developments and Strategies
102.3.6. Uniper SE
102.3.6.1. Company Overview
102.3.6.2. Business Portfolio
102.3.6.3. Financials
102.3.6.4. Geographical Footprint
102.3.6.5. SWOT Analysis
102.3.6.6. Recent Developments and Strategies
102.3.7. Toyo Engineering Corporation
102.3.7.1. Company Overview
102.3.7.2. Business Portfolio
102.3.7.3. Financials
102.3.7.4. Geographical Footprint
102.3.7.5. SWOT Analysis
102.3.7.6. Recent Developments and Strategies
102.3.8. OCOchem
102.3.8.1. Company Overview
102.3.8.2. Business Portfolio
102.3.8.3. Financials
102.3.8.4. Geographical Footprint
102.3.8.5. SWOT Analysis
102.3.8.6. Recent Developments and Strategies
102.3.9. Carbon Clean Solutions
102.3.9.1. Company Overview
102.3.9.2. Business Portfolio
102.3.9.3. Financials
102.3.9.4. Geographical Footprint
102.3.9.5. SWOT Analysis
102.3.9.6. Recent Developments and Strategies
102.3.10. Air Company
102.3.10.1. Company Overview
102.3.10.2. Business Portfolio
102.3.10.3. Financials
102.3.10.4. Geographical Footprint
102.3.10.5. SWOT Analysis
102.3.10.6. Recent Developments and Strategies
102.3.11. Others
103. Appendix

- Get Started -
Get insights that lead to new growth opportunities
- Talk to Experts -
Get answers to your queries on this report from our experts
Frequently Asked Questions
The global Carbon-to-Specialty Chemicals market in 2025 was $US 3.2 Billion.
The global Carbon-to-Specialty Chemicals market will be $US 17.6 Billion by 2036.
The expected growth rate (CAGR%) of the global Carbon-to-Specialty Chemicals market is 14.6% for the period 2026-2036.
Industrial Decarbonization Policy and Public Funding Across Europe, Asia, and North America, and Rising Demand for Lower-Carbon Fuels and Materials from Aviation, Packaging, and Chemical Buyers Worldwide.
Thermochemical Conversion was the largest segment in technology segment with around 42% revenue share among all in Carbon-to-Specialty Chemicals Market in 2025.
Asia Pacific was the leading regions for Carbon-to-Specialty Chemicals holding 38% of the global market in 2025.
LanzaTech Global Inc., Twelve Benefit Corporation, Dioxycle, Mitsubishi Gas Chemical Company, Perstorp Holding AB, Uniper SE, Toyo Engineering Corporation, OCOchem, Carbon Clean Solutions, Air Company and Others.