

PFAS Alternatives Market
PFAS Alternatives Market (Type: Silicone-based Polymers, Fluorine-free Surfactants, Paraffin-based Waxes, Bio-based Alternatives, Ceramic Coatings and Others; Technology: Sol-gel Coatings, Plasma Surface Treatment, Enzymatic Finishing, Polymer Substitution and Others; Application: Food Packaging, Firefighting Foam, Textile & Apparel, Non-stick Coatings in Cookware, PCB Laminates, Conformal Coatings, Wire & Cable Insulation, Battery Materials, Medical Devices, Cosmetics Additives, Filtration & Membranes, Automotive Components, Aerospace Components and Others; End-use Industry: Food & Beverage, Healthcare & Pharmaceuticals, Electronics & Semiconductor, Automotive & Transportation, Aerospace & Defense, Chemicals & Industrial Manufacturing, Energy & Utilities, Consumer Goods, Textile, Cosmetics & Personal Care and Others) – Global Industry Analysis, Shares, Growth, Trends and Forecast 2021-2036
Categories:
All, Chemicals and Materials, Food and Consumer Goods
| Format: PDF/PPT/Excel
| Product ID:
4649
| Report Version:
July 2026
- Report Preview
- Table of Content
- Request Customization
Market Snappshot
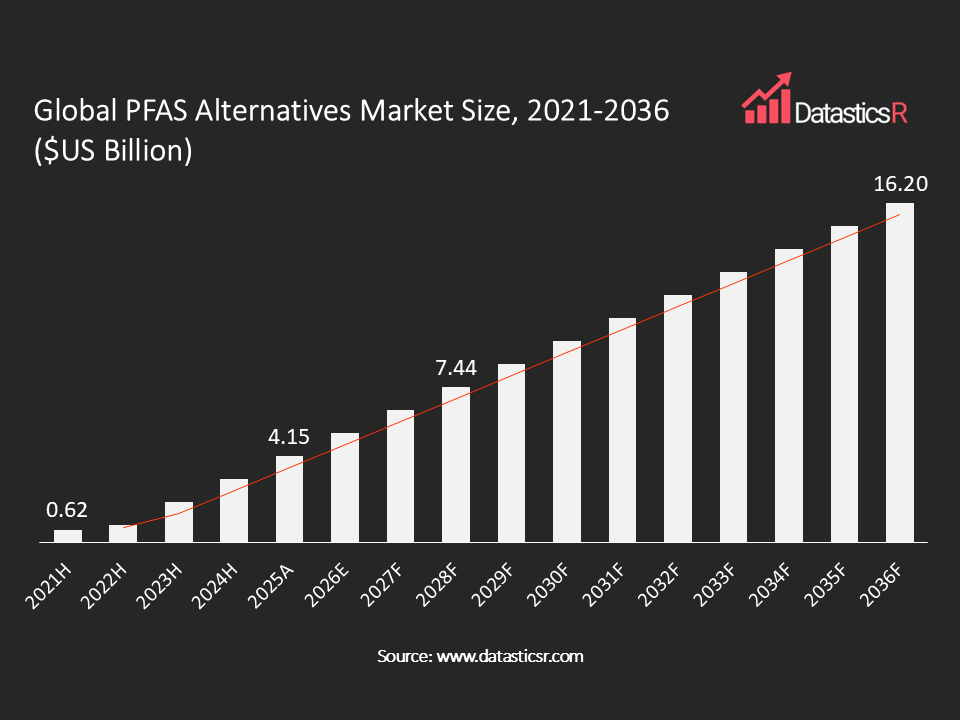
- Market Size in 2025: $US 4.15 Bn
- Forecast Market by 2036: $US 16.2 Bn
- CAGR for the Period 2026-2036: 11.9%
- Top Region in Terms of Market Share: North America (36%)
- Key Players: Chemours, DuPont, Daikin Industries, Solvay, Archroma, Huntsman Corporation, Dow Inc., Rudolf Group, Saint-Gobain, Shin-Etsu Chemical, and Others
Analyst Viewpoint:
This is a market being built by regulators as much as by chemists. Every major substitution cycle here traces back to a specific rule; EPA’s CERCLA hazardous substance designation for PFOA and PFOS, the EU’s REACH restriction proposal, or one of the growing lists of state-level bans in California, Minnesota, and Colorado. Silicone-based chemistries and fluorine-free surfactants are getting commercial traction fastest, mainly because they can be dropped into existing coating and finishing lines without a full retooling. The harder problem is packaging and textiles, where buyers want chemical parity with legacy PFAS on water and grease resistance without the phase-out risk, and that performance gap hasn’t fully closed everywhere. Expect the next few years to separate genuine chemistry innovators from companies simply rebranding existing non-fluorinated products as PFAS alternatives to capture brand attention, supplier qualification and documentation, not marketing claims, will be what actually wins contracts.
PFAS Alternatives Market Overview:
PFAS alternatives are specialty chemistries and materials engineered to replace per- and polyfluoroalkyl substances, the so-called forever chemicals, across applications that depend on water, oil, grease, heat, or chemical resistance. This includes fluorine-free surfactants, silicone-based elastomers and resins, hydrocarbon and paraffin waxes, bio-based coatings, ceramic and sol-gel treatments, and plasma-based surface modification technologies. These substitutes are increasingly used across packaging, textiles and apparel, firefighting foams, electronics, personal care, and consumer goods, wherever legacy PFAS use is being phased out under regulatory or brand pressure.
Adoption is strongest where regulation has moved fastest: food-contact packaging, textiles, and firefighting foams, all of which face explicit phase-out deadlines in multiple jurisdictions. Packaging currently holds the largest share of the market, driven by rapid substitution of fluorinated grease-resistant coatings in food wraps, molded fiber products, and disposable containers. Manufacturing challenges remain significant, since matching the low surface energy and thermal stability of legacy PFAS without the same environmental persistence typically requires new formulation chemistry, extended mill or plant trials, and separate certification pathways for each end-use category.
The industry has shifted markedly over the past three years, from a research-stage substitution problem into a supplier qualification market, where buyers assess whether a given alternative survives washing, meets fluorine-screening thresholds, and performs on existing production lines. With the EU’s broader PFAS restriction proposal advancing and additional US state-level bans taking effect through 2025 and 2032, demand for documented, certified non-fluorinated chemistries is expected to keep outpacing broader specialty chemicals growth through the forecast period.
Adoption is strongest where regulation has moved fastest: food-contact packaging, textiles, and firefighting foams, all of which face explicit phase-out deadlines in multiple jurisdictions. Packaging currently holds the largest share of the market, driven by rapid substitution of fluorinated grease-resistant coatings in food wraps, molded fiber products, and disposable containers. Manufacturing challenges remain significant, since matching the low surface energy and thermal stability of legacy PFAS without the same environmental persistence typically requires new formulation chemistry, extended mill or plant trials, and separate certification pathways for each end-use category.
The industry has shifted markedly over the past three years, from a research-stage substitution problem into a supplier qualification market, where buyers assess whether a given alternative survives washing, meets fluorine-screening thresholds, and performs on existing production lines. With the EU’s broader PFAS restriction proposal advancing and additional US state-level bans taking effect through 2025 and 2032, demand for documented, certified non-fluorinated chemistries is expected to keep outpacing broader specialty chemicals growth through the forecast period.
| Drivers | Regulatory Phase-Out Mandates are Forcing Time-Bound Substitution across Major Markets |
| Brand and Retailer Sustainability Commitments are Accelerating Voluntary Substitution in Packaging and Textiles |
Regulatory Phase-Out Mandates are Forcing Time-Bound Substitution across Major Markets
Regulatory phase-out mandates are forcing the chemistry company to incline towards PFAS-free product line. In April 2024, the US EPA designated both PFOA and PFOS as hazardous substances under CERCLA, a decision that raised the legal and financial exposure for anyone still using legacy PFAS enough that “phase it out eventually” stopped being a viable strategy. California layered its own textile, cosmetics, and food packaging prohibitions on top of that starting January 2025, and New York, Minnesota, and Colorado have since added their own product-specific bans, with compliance deadlines stretching out to 2032.
Europe hasn’t been shy about going further. The European Chemicals Agency’s revised PFAS restriction proposal, published in August 2025, is shaping up to be one of the broadest chemical bans ever attempted anywhere, touching several thousand PFAS-related substances and applications across the EU in one sweep. Canada took a comparable step, adding most PFAS other than fluoropolymers to Schedule 1 of the Canadian Environmental Protection Act, with phased restrictions starting in 2025.
Asia Pacific is regulating differently, but the direction is the same. Japan’s response has leaned toward monitoring first; a public blood-screening program launched in November 2024 following contaminated water leakage put PFAS squarely in front of consumers, and its existing Chemical Substances Control Law is tightening in parallel. China has taken a listing approach, adding PFAS to its List of New Contaminants Under Priority Control and its Catalog of Toxic Chemicals under Severe Restrictions, which is nudging domestic manufacturers. Brazil is earlier in the process but moving: Bill No. 2726/2023, introduced in August 2023, would establish a National PFAS Control Policy, and its progress is already being watched by regional manufacturers positioning ahead of it.
None of these regimes look alike on paper, one is a hazardous-substance designation, another is a screening program, another is a proposed bill, but they’re converging on the same practical outcome. A company selling across the US, EU, Canada, and Asia Pacific increasingly can’t afford to formulate market by market; it needs one non-fluorinated chemistry that clears the strictest rule in every region it touches. That’s quietly become the real engineering brief behind most PFAS substitution work today, more than any individual ban.
Europe hasn’t been shy about going further. The European Chemicals Agency’s revised PFAS restriction proposal, published in August 2025, is shaping up to be one of the broadest chemical bans ever attempted anywhere, touching several thousand PFAS-related substances and applications across the EU in one sweep. Canada took a comparable step, adding most PFAS other than fluoropolymers to Schedule 1 of the Canadian Environmental Protection Act, with phased restrictions starting in 2025.
Asia Pacific is regulating differently, but the direction is the same. Japan’s response has leaned toward monitoring first; a public blood-screening program launched in November 2024 following contaminated water leakage put PFAS squarely in front of consumers, and its existing Chemical Substances Control Law is tightening in parallel. China has taken a listing approach, adding PFAS to its List of New Contaminants Under Priority Control and its Catalog of Toxic Chemicals under Severe Restrictions, which is nudging domestic manufacturers. Brazil is earlier in the process but moving: Bill No. 2726/2023, introduced in August 2023, would establish a National PFAS Control Policy, and its progress is already being watched by regional manufacturers positioning ahead of it.
None of these regimes look alike on paper, one is a hazardous-substance designation, another is a screening program, another is a proposed bill, but they’re converging on the same practical outcome. A company selling across the US, EU, Canada, and Asia Pacific increasingly can’t afford to formulate market by market; it needs one non-fluorinated chemistry that clears the strictest rule in every region it touches. That’s quietly become the real engineering brief behind most PFAS substitution work today, more than any individual ban.
Brand and Retailer Sustainability Commitments are Accelerating Voluntary Substitution in Packaging and Textiles
Regulations explain why companies eventually have to switch. They don’t fully explain why so many are switching early. Packaging is the clearest example: it’s already the single largest application for PFAS alternatives, and a lot of that shift is being driven by food and beverage brands publicly committing to PFAS-free packaging on their own timelines, well before any specific ban applies to them. Molded fiber containers, paper food wraps, and disposable packaging are moving toward fluorine-free grease-resistant coatings largely because a retailer or brand decided it mattered to their customers, not because a regulator told them to.
Textiles also tell a similar story, just with a different gatekeeper. The ZDHC Foundation’s Manufacturing restricted substances list, now in its third version, has effectively made PFAS unacceptable across a huge slice of the fashion and textile supply chain. Archroma brought a plant-based, non-PFAS durable water repellent to market in April 2024, and Bolger & O’Hearn followed a month earlier with its own fluorine-free repellent.
This makes the demand more durable than it might first appear is how qualification actually works in these industries. Getting a new chemistry approved by a textile mill or a packaging converter isn’t a quick swap; it takes trials, audits, and sign-off from the brand’s own chemical management program. Once a supplier has cleared that bar, nobody wants to go through it twice, which means brand-driven substitution tends to stick even if a regulatory deadline gets pushed.
Textiles also tell a similar story, just with a different gatekeeper. The ZDHC Foundation’s Manufacturing restricted substances list, now in its third version, has effectively made PFAS unacceptable across a huge slice of the fashion and textile supply chain. Archroma brought a plant-based, non-PFAS durable water repellent to market in April 2024, and Bolger & O’Hearn followed a month earlier with its own fluorine-free repellent.
This makes the demand more durable than it might first appear is how qualification actually works in these industries. Getting a new chemistry approved by a textile mill or a packaging converter isn’t a quick swap; it takes trials, audits, and sign-off from the brand’s own chemical management program. Once a supplier has cleared that bar, nobody wants to go through it twice, which means brand-driven substitution tends to stick even if a regulatory deadline gets pushed.
PFAS Alternatives Regional Market Outlook:
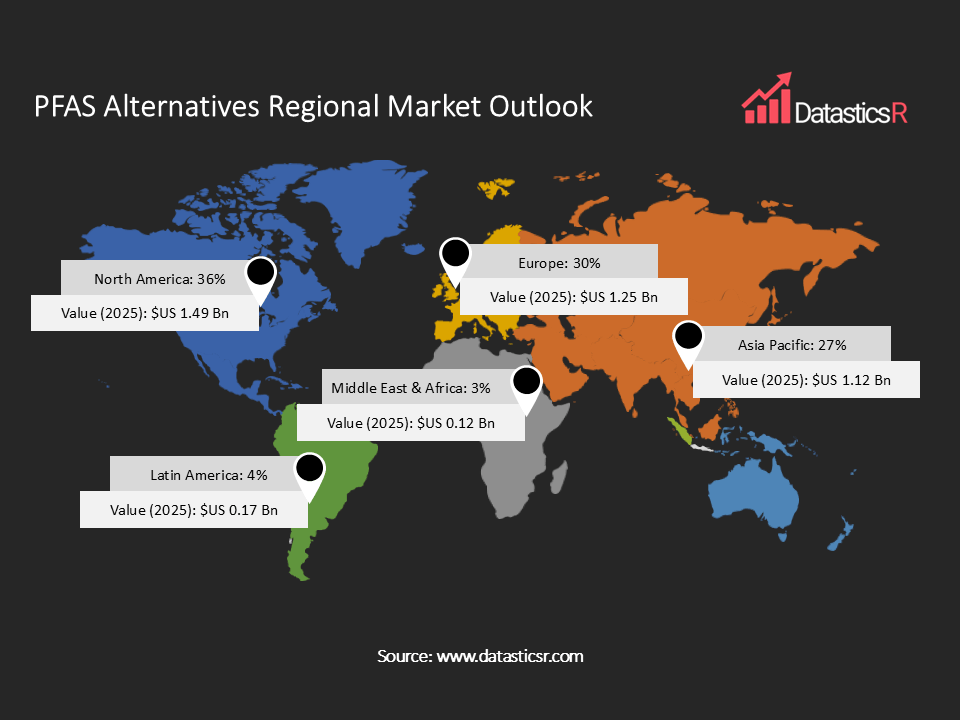
The largest regional market in the PFAS alternatives industry is North America with its 36% share because of the density of state regulations and the actions of the US EPA, while the United States alone represents the biggest demand. Europe is ranked second with about 30% share since the framework of restrictions in the EU based on the REACH regulation encourages the development of silicone, biodegradable, and hydrocarbon alternatives in Germany, France, and Netherlands long before the final dates of compliance with the requirements. Asia-Pacific occupies the third place in terms of shares, having approximately 27%, but it is the leading region in terms of growth due to the increasing substitution capacities in China and India for export-oriented textiles and electronic manufacturing. Latin America is represented by only 4% and headed by Brazil, but grows due to the alignment of national brands with the international standards. The Middle East & Africa is the smallest region at approximately 3% share.
Key Companies in PFAS Alternatives Market:
The competitive set spans large diversified chemical producers with legacy fluorochemical businesses now pivoting toward alternatives, and smaller specialty players competing purely on non-fluorinated formulation expertise. Much of the recent activity centers on new product launches validated through mill or plant trials, certification partnerships tied to retailer chemical management programs, and capacity investments in silicone-based and bio-based chemistry lines, as companies work to convert regulatory tailwinds into locked-in supplier relationships.
Key companies include Chemours, DuPont, Daikin Industries, Solvay, Archroma, Huntsman Corporation, Dow Inc., Rudolf Group, Saint-Gobain, Shin-Etsu Chemical, Evonik Industries, Mitsui Chemicals, Victrex, Avient Corporation, and others.
Key companies include Chemours, DuPont, Daikin Industries, Solvay, Archroma, Huntsman Corporation, Dow Inc., Rudolf Group, Saint-Gobain, Shin-Etsu Chemical, Evonik Industries, Mitsui Chemicals, Victrex, Avient Corporation, and others.
Key Developments in PFAS Alternatives Market:
| 1. Clariant launches innovative PFAS-free polymer processing aids for more sustainable polyolefin extrusion: In June 2025, Clariant announced the launch of its new AddWorks PPA product line, a new generation of PFAS-free polymer processing aids designed specifically for polyolefin extrusion applications. This innovative solution addresses the industry’s growing need for more sustainable alternatives to conventional fluoropolymer-based processing aids while maintaining strong performance standards. |
| 2. Archroma Launches Plant-Based PFAS-Free Repellent Chemistry: In April 2024, Archroma introduced PHOBOTEX NTR-50 LIQ, a plant-based non-PFAS durable water repellent chemistry targeted at textile and nonwoven applications |
PFAS Alternatives Market Attributes:
| ATTRIBUTE | DETAILS |
| Market Value, 2025 | $US 4.15 Billion |
| Forecasted Market Value, 2036 | $US 16.20 Billion |
| CAGR (2026-2036) | 11.9% |
| Analysis Period | 2021-2036 |
| Historic Period | 2021-2024 |
| Base Year | 2025 |
| Forecast Period | 2026-2036 |
| Volume Ton | Tons |
| Value Ton | $US Billion |
| Market Segmentation | By Type
By Technology
By Application
By End-use Industry
By Region
|
| Companies Profiles |
|
| Customization Request | Available upon request |
1. Introduction
1.1. Report Scope
1.2. Market Segmentations and Definitions
1.3. Geographical Coverage
2. Executive Summary
2.1. Key Facts and Figures
2.2. Trends Impacting the Market
2.3. DatasticsR Growth Opportunity Matrix
3. Market Overview
3.1. Global PFAS Alternatives Market Analysis and Forecast, 2021-2036
3.1.1. Global PFAS Alternatives Market Size (Tons)
3.1.2. Global PFAS Alternatives Market Size ($US Bn)
3.2. Supply-side and Demand-side Trends
3.3. Technology Roadmap and Developments
3.4. Market Dynamics
3.4.1. Drivers
3.4.2. Restraints
3.4.3. Opportunities
3.5. Porter’s Five Forces Analysis
3.6. PESTL Analysis
3.7. Industry SWOT Analysis
3.8. Regulatory Landscape
3.9. Value Chain Analysis
3.9.1. List of Raw Materials Suppliers
3.9.2. List of Manufacturers
3.9.3. List of Dealers / Distributors
3.9.4. List of Importers / Exporters
3.9.5. List of Potential Customers
3.10. Impact of Current Geopolitical Scenario on the Market
4. Technical Analysis
4.1. Product Specification Analysis
4.2. Details of Production Process
4.3. Technology Adoption and Emerging Technologies
4.4. R&D Trends and Patents Landscape
4.5. Cost Structure and Profitability Analysis
5. Global PFAS Alternatives Production (Tons) Output, by Region, 2025
5.1. North America
5.2. Europe
5.3. Asia Pacific
5.4. Latin America
5.5. Middle East and Africa
6. Import-export Analysis Volume (Tons) and Value ($US Bn), by Key Country, 2021-2025
7. Price Trend Analysis and Forecasting ($US/ Ton), 2021-2036
7.1. Price Trend Analysis and Forecasting, by Type
7.2. Price Trend Analysis and Forecasting, by Technology
7.3. Price Trend Analysis and Forecasting, by Region
8. Global PFAS Alternatives Market Analysis and Forecasting (Tons) ($US Bn), by Type, 2021-2036
9. Global PFAS Alternatives Market Analysis and Forecasting (Tons) ($US Bn), by Technology, 2021-2036
10. Global PFAS Alternatives Market Analysis and Forecasting (Tons) ($US Bn), by Application, 2021-2036
11. Global PFAS Alternatives Market Analysis and Forecasting (Tons) ($US Bn), by End-use Industry, 2021-2036
12. Global PFAS Alternatives Market Analysis and Forecasting (Tons) ($US Bn), by Region, 2021-2036
13. North America PFAS Alternatives Market Analysis and Forecasting (Tons) ($US Bn), by Type, 2021-2036
14. North America PFAS Alternatives Market Analysis and Forecasting (Tons) ($US Bn), by Technology, 2021-2036
15. North America PFAS Alternatives Market Analysis and Forecasting (Tons) ($US Bn), by Application, 2021-2036
16. North America PFAS Alternatives Market Analysis and Forecasting (Tons) ($US Bn), by End-use Industry, 2021-2036
17. U.S. PFAS Alternatives Market Analysis and Forecasting (Tons) ($US Bn), by Type, 2021-2036
18. U.S. PFAS Alternatives Market Analysis and Forecasting (Tons) ($US Bn), by Technology, 2021-2036
19. U.S. PFAS Alternatives Market Analysis and Forecasting (Tons) ($US Bn), by Application, 2021-2036
20. U.S. PFAS Alternatives Market Analysis and Forecasting (Tons) ($US Bn), by End-use Industry, 2021-2036
21. Canada PFAS Alternatives Market Analysis and Forecasting (Tons) ($US Bn), by Type, 2021-2036
22. Canada PFAS Alternatives Market Analysis and Forecasting (Tons) ($US Bn), by Technology, 2021-2036
23. Canada PFAS Alternatives Market Analysis and Forecasting (Tons) ($US Bn), by Application, 2021-2036
24. Canada PFAS Alternatives Market Analysis and Forecasting (Tons) ($US Bn), by End-use Industry, 2021-2036
25. Europe PFAS Alternatives Market Analysis and Forecasting (Tons) ($US Bn), by Type, 2021-2036
26. Europe PFAS Alternatives Market Analysis and Forecasting (Tons) ($US Bn), by Technology, 2021-2036
27. Europe PFAS Alternatives Market Analysis and Forecasting (Tons) ($US Bn), by Application, 2021-2036
28. Europe PFAS Alternatives Market Analysis and Forecasting (Tons) ($US Bn), by End-use Industry, 2021-2036
29. Germany PFAS Alternatives Market Analysis and Forecasting (Tons) ($US Bn), by Type, 2021-2036
30. Germany PFAS Alternatives Market Analysis and Forecasting (Tons) ($US Bn), by Technology, 2021-2036
31. Germany PFAS Alternatives Market Analysis and Forecasting (Tons) ($US Bn), by Application, 2021-2036
32. Germany PFAS Alternatives Market Analysis and Forecasting (Tons) ($US Bn), by End-use Industry, 2021-2036
33. U.K. PFAS Alternatives Market Analysis and Forecasting (Tons) ($US Bn), by Type, 2021-2036
34. U.K. PFAS Alternatives Market Analysis and Forecasting (Tons) ($US Bn), by Technology, 2021-2036
35. U.K. PFAS Alternatives Market Analysis and Forecasting (Tons) ($US Bn), by Application, 2021-2036
36. U.K. PFAS Alternatives Market Analysis and Forecasting (Tons) ($US Bn), by End-use Industry, 2021-2036
37. France PFAS Alternatives Market Analysis and Forecasting (Tons) ($US Bn), by Type, 2021-2036
38. France PFAS Alternatives Market Analysis and Forecasting (Tons) ($US Bn), by Technology, 2021-2036
39. France PFAS Alternatives Market Analysis and Forecasting (Tons) ($US Bn), by Application, 2021-2036
40. France PFAS Alternatives Market Analysis and Forecasting (Tons) ($US Bn), by End-use Industry, 2021-2036
41. Italy PFAS Alternatives Market Analysis and Forecasting (Tons) ($US Bn), by Type, 2021-2036
42. Italy PFAS Alternatives Market Analysis and Forecasting (Tons) ($US Bn), by Technology, 2021-2036
43. Italy PFAS Alternatives Market Analysis and Forecasting (Tons) ($US Bn), by Application, 2021-2036
44. Italy PFAS Alternatives Market Analysis and Forecasting (Tons) ($US Bn), by End-use Industry, 2021-2036
45. Spain PFAS Alternatives Market Analysis and Forecasting (Tons) ($US Bn), by Type, 2021-2036
46. Spain PFAS Alternatives Market Analysis and Forecasting (Tons) ($US Bn), by Technology, 2021-2036
47. Spain PFAS Alternatives Market Analysis and Forecasting (Tons) ($US Bn), by Application, 2021-2036
48. Spain PFAS Alternatives Market Analysis and Forecasting (Tons) ($US Bn), by End-use Industry, 2021-2036
49. Russia & CIS PFAS Alternatives Market Analysis and Forecasting (Tons) ($US Bn), by Type, 2021-2036
50. Russia & CIS PFAS Alternatives Market Analysis and Forecasting (Tons) ($US Bn), by Technology, 2021-2036
51. Russia & CIS PFAS Alternatives Market Analysis and Forecasting (Tons) ($US Bn), by Application, 2021-2036
52. Russia & CIS PFAS Alternatives Market Analysis and Forecasting (Tons) ($US Bn), by End-use Industry, 2021-2036
53. Rest of Europe PFAS Alternatives Market Analysis and Forecasting (Tons) ($US Bn), by Type, 2021-2036
54. Rest of Europe PFAS Alternatives Market Analysis and Forecasting (Tons) ($US Bn), by Technology, 2021-2036
55. Rest of Europe PFAS Alternatives Market Analysis and Forecasting (Tons) ($US Bn), by Application, 2021-2036
56. Rest of Europe PFAS Alternatives Market Analysis and Forecasting (Tons) ($US Bn), by End-use Industry, 2021-2036
57. Asia Pacific PFAS Alternatives Market Analysis and Forecasting (Tons) ($US Bn), by Type, 2021-2036
58. Asia Pacific PFAS Alternatives Market Analysis and Forecasting (Tons) ($US Bn), by Technology, 2021-2036
59. Asia Pacific PFAS Alternatives Market Analysis and Forecasting (Tons) ($US Bn), by Application, 2021-2036
60. Asia Pacific PFAS Alternatives Market Analysis and Forecasting (Tons) ($US Bn), by End-use Industry, 2021-2036
61. China PFAS Alternatives Market Analysis and Forecasting (Tons) ($US Bn), by Type, 2021-2036
62. China PFAS Alternatives Market Analysis and Forecasting (Tons) ($US Bn), by Technology, 2021-2036
63. China PFAS Alternatives Market Analysis and Forecasting (Tons) ($US Bn), by Application, 2021-2036
64. China PFAS Alternatives Market Analysis and Forecasting (Tons) ($US Bn), by End-use Industry, 2021-2036
65. India PFAS Alternatives Market Analysis and Forecasting (Tons) ($US Bn), by Type, 2021-2036
66. India PFAS Alternatives Market Analysis and Forecasting (Tons) ($US Bn), by Technology, 2021-2036
67. India PFAS Alternatives Market Analysis and Forecasting (Tons) ($US Bn), by Application, 2021-2036
68. India PFAS Alternatives Market Analysis and Forecasting (Tons) ($US Bn), by End-use Industry, 2021-2036
69. Japan PFAS Alternatives Market Analysis and Forecasting (Tons) ($US Bn), by Type, 2021-2036
70. Japan PFAS Alternatives Market Analysis and Forecasting (Tons) ($US Bn), by Technology, 2021-2036
71. Japan PFAS Alternatives Market Analysis and Forecasting (Tons) ($US Bn), by Application, 2021-2036
72. Japan PFAS Alternatives Market Analysis and Forecasting (Tons) ($US Bn), by End-use Industry, 2021-2036
73. South Korea PFAS Alternatives Market Analysis and Forecasting (Tons) ($US Bn), by Type, 2021-2036
74. South Korea PFAS Alternatives Market Analysis and Forecasting (Tons) ($US Bn), by Technology, 2021-2036
75. South Korea PFAS Alternatives Market Analysis and Forecasting (Tons) ($US Bn), by Application, 2021-2036
76. South Korea PFAS Alternatives Market Analysis and Forecasting (Tons) ($US Bn), by End-use Industry, 2021-2036
77. Taiwan PFAS Alternatives Market Analysis and Forecasting (Tons) ($US Bn), by Type, 2021-2036
78. Taiwan PFAS Alternatives Market Analysis and Forecasting (Tons) ($US Bn), by Technology, 2021-2036
79. Taiwan PFAS Alternatives Market Analysis and Forecasting (Tons) ($US Bn), by Application, 2021-2036
80. Taiwan PFAS Alternatives Market Analysis and Forecasting (Tons) ($US Bn), by End-use Industry, 2021-2036
81. Australia PFAS Alternatives Market Analysis and Forecasting (Tons) ($US Bn), by Type, 2021-2036
82. Australia PFAS Alternatives Market Analysis and Forecasting (Tons) ($US Bn), by Technology, 2021-2036
83. Australia PFAS Alternatives Market Analysis and Forecasting (Tons) ($US Bn), by Application, 2021-2036
84. Australia PFAS Alternatives Market Analysis and Forecasting (Tons) ($US Bn), by End-use Industry, 2021-2036
85. ASEAN PFAS Alternatives Market Analysis and Forecasting (Tons) ($US Bn), by Type, 2021-2036
86. ASEAN PFAS Alternatives Market Analysis and Forecasting (Tons) ($US Bn), by Technology, 2021-2036
87. ASEAN PFAS Alternatives Market Analysis and Forecasting (Tons) ($US Bn), by Application, 2021-2036
88. ASEAN PFAS Alternatives Market Analysis and Forecasting (Tons) ($US Bn), by End-use Industry, 2021-2036
89. Rest of Asia Pacific PFAS Alternatives Market Analysis and Forecasting (Tons) ($US Bn), by Type, 2021-2036
90. Rest of Asia Pacific PFAS Alternatives Market Analysis and Forecasting (Tons) ($US Bn), by Technology, 2021-2036
91. Rest of Asia Pacific PFAS Alternatives Market Analysis and Forecasting (Tons) ($US Bn), by Application, 2021-2036
92. Rest of Asia Pacific PFAS Alternatives Market Analysis and Forecasting (Tons) ($US Bn), by End-use Industry, 2021-2036
93. Latin America PFAS Alternatives Market Analysis and Forecasting (Tons) ($US Bn), by Type, 2021-2036
94. Latin America PFAS Alternatives Market Analysis and Forecasting (Tons) ($US Bn), by Technology, 2021-2036
95. Latin America PFAS Alternatives Market Analysis and Forecasting (Tons) ($US Bn), by Application, 2021-2036
96. Latin America PFAS Alternatives Market Analysis and Forecasting (Tons) ($US Bn), by End-use Industry, 2021-2036
97. Brazil PFAS Alternatives Market Analysis and Forecasting (Tons) ($US Bn), by Type, 2021-2036
98. Brazil PFAS Alternatives Market Analysis and Forecasting (Tons) ($US Bn), by Technology, 2021-2036
99. Brazil PFAS Alternatives Market Analysis and Forecasting (Tons) ($US Bn), by Application, 2021-2036
100. Brazil PFAS Alternatives Market Analysis and Forecasting (Tons) ($US Bn), by End-use Industry, 2021-2036
101. Mexico PFAS Alternatives Market Analysis and Forecasting (Tons) ($US Bn), by Type, 2021-2036
102. Mexico PFAS Alternatives Market Analysis and Forecasting (Tons) ($US Bn), by Technology, 2021-2036
103. Mexico PFAS Alternatives Market Analysis and Forecasting (Tons) ($US Bn), by Application, 2021-2036
104. Mexico PFAS Alternatives Market Analysis and Forecasting (Tons) ($US Bn), by End-use Industry, 2021-2036
105. Argentina PFAS Alternatives Market Analysis and Forecasting (Tons) ($US Bn), by Type, 2021-2036
106. Argentina PFAS Alternatives Market Analysis and Forecasting (Tons) ($US Bn), by Technology, 2021-2036
107. Argentina PFAS Alternatives Market Analysis and Forecasting (Tons) ($US Bn), by Application, 2021-2036
108. Argentina PFAS Alternatives Market Analysis and Forecasting (Tons) ($US Bn), by End-use Industry, 2021-2036
109. Rest of Latin America PFAS Alternatives Market Analysis and Forecasting (Tons) ($US Bn), by Type, 2021-2036
110. Rest of Latin America PFAS Alternatives Market Analysis and Forecasting (Tons) ($US Bn), by Technology, 2021-2036
111. Rest of Latin America PFAS Alternatives Market Analysis and Forecasting (Tons) ($US Bn), by Application, 2021-2036
112. Rest of Latin America PFAS Alternatives Market Analysis and Forecasting (Tons) ($US Bn), by End-use Industry, 2021-2036
113. Middle East & Africa PFAS Alternatives Market Analysis and Forecasting (Tons) ($US Bn), by Type, 2021-2036
114. Middle East & Africa PFAS Alternatives Market Analysis and Forecasting (Tons) ($US Bn), by Technology, 2021-2036
115. Middle East & Africa PFAS Alternatives Market Analysis and Forecasting (Tons) ($US Bn), by Application, 2021-2036
116. Middle East & Africa PFAS Alternatives Market Analysis and Forecasting (Tons) ($US Bn), by End-use Industry, 2021-2036
117. Saudi Arabia PFAS Alternatives Market Analysis and Forecasting (Tons) ($US Bn), by Type, 2021-2036
118. Saudi Arabia PFAS Alternatives Market Analysis and Forecasting (Tons) ($US Bn), by Technology, 2021-2036
119. Saudi Arabia PFAS Alternatives Market Analysis and Forecasting (Tons) ($US Bn), by Application, 2021-2036
120. Saudi Arabia PFAS Alternatives Market Analysis and Forecasting (Tons) ($US Bn), by End-use Industry, 2021-2036
121. UAE PFAS Alternatives Market Analysis and Forecasting (Tons) ($US Bn), by Type, 2021-2036
122. UAE PFAS Alternatives Market Analysis and Forecasting (Tons) ($US Bn), by Technology, 2021-2036
123. UAE PFAS Alternatives Market Analysis and Forecasting (Tons) ($US Bn), by Application, 2021-2036
124. UAE PFAS Alternatives Market Analysis and Forecasting (Tons) ($US Bn), by End-use Industry, 2021-2036
125. South Africa PFAS Alternatives Market Analysis and Forecasting (Tons) ($US Bn), by Type, 2021-2036
126. South Africa PFAS Alternatives Market Analysis and Forecasting (Tons) ($US Bn), by Technology, 2021-2036
127. South Africa PFAS Alternatives Market Analysis and Forecasting (Tons) ($US Bn), by Application, 2021-2036
128. South Africa PFAS Alternatives Market Analysis and Forecasting (Tons) ($US Bn), by End-use Industry, 2021-2036
129. Rest of Middle East & Africa PFAS Alternatives Market Analysis and Forecasting (Tons) ($US Bn), by Type, 2021-2036
130. Rest of Middle East & Africa PFAS Alternatives Market Analysis and Forecasting (Tons) ($US Bn), by Technology, 2021-2036
131. Rest of Middle East & Africa PFAS Alternatives Market Analysis and Forecasting (Tons) ($US Bn), by Application, 2021-2036
132. Rest of Middle East & Africa PFAS Alternatives Market Analysis and Forecasting (Tons) ($US Bn), by End-use Industry, 2021-2036
133. Competition Landscape
133.1. Market Share Analysis (%), by Company, 2025
133.2. Competitive Benchmarking
133.3. Company Profiles
133.3.1. Chemours
133.3.1.1. Company Overview
133.3.1.2. Business Portfolio
133.3.1.3. Financials
133.3.1.4. Geographical Footprint
133.3.1.5. SWOT Analysis
133.3.1.6. Recent Developments and Strategies
133.3.2. DuPont
133.3.2.1. Company Overview
133.3.2.2. Business Portfolio
133.3.2.3. Financials
133.3.2.4. Geographical Footprint
133.3.2.5. SWOT Analysis
133.3.2.6. Recent Developments and Strategies
133.3.3. Daikin Industries
133.3.3.1. Company Overview
133.3.3.2. Business Portfolio
133.3.3.3. Financials
133.3.3.4. Geographical Footprint
133.3.3.5. SWOT Analysis
133.3.3.6. Recent Developments and Strategies
133.3.4. Solvay
133.3.4.1. Company Overview
133.3.4.2. Business Portfolio
133.3.4.3. Financials
133.3.4.4. Geographical Footprint
133.3.4.5. SWOT Analysis
133.3.4.6. Recent Developments and Strategies
133.3.5. Archroma
133.3.5.1. Company Overview
133.3.5.2. Business Portfolio
133.3.5.3. Financials
133.3.5.4. Geographical Footprint
133.3.5.5. SWOT Analysis
133.3.5.6. Recent Developments and Strategies
133.3.6. Huntsman Corporation
133.3.6.1. Company Overview
133.3.6.2. Business Portfolio
133.3.6.3. Financials
133.3.6.4. Geographical Footprint
133.3.6.5. SWOT Analysis
133.3.6.6. Recent Developments and Strategies
133.3.7. Dow Inc.
133.3.7.1. Company Overview
133.3.7.2. Business Portfolio
133.3.7.3. Financials
133.3.7.4. Geographical Footprint
133.3.7.5. SWOT Analysis
133.3.7.6. Recent Developments and Strategies
133.3.8. Rudolf Group
133.3.8.1. Company Overview
133.3.8.2. Business Portfolio
133.3.8.3. Financials
133.3.8.4. Geographical Footprint
133.3.8.5. SWOT Analysis
133.3.8.6. Recent Developments and Strategies
133.3.9. Saint-Gobain
133.3.9.1. Company Overview
133.3.9.2. Business Portfolio
133.3.9.3. Financials
133.3.9.4. Geographical Footprint
133.3.9.5. SWOT Analysis
133.3.9.6. Recent Developments and Strategies
133.3.10. Shin-Etsu Chemical
133.3.10.1. Company Overview
133.3.10.2. Business Portfolio
133.3.10.3. Financials
133.3.10.4. Geographical Footprint
133.3.10.5. SWOT Analysis
133.3.10.6. Recent Developments and Strategies
133.3.11. Evonik Industries
133.3.11.1. Company Overview
133.3.11.2. Business Portfolio
133.3.11.3. Financials
133.3.11.4. Geographical Footprint
133.3.11.5. SWOT Analysis
133.3.11.6. Recent Developments and Strategies
133.3.12. Mitsui Chemicals
133.3.12.1. Company Overview
133.3.12.2. Business Portfolio
133.3.12.3. Financials
133.3.12.4. Geographical Footprint
133.3.12.5. SWOT Analysis
133.3.12.6. Recent Developments and Strategies
133.3.13. Victrex
133.3.13.1. Company Overview
133.3.13.2. Business Portfolio
133.3.13.3. Financials
133.3.13.4. Geographical Footprint
133.3.13.5. SWOT Analysis
133.3.13.6. Recent Developments and Strategies
133.3.14. Avient Corporation
133.3.14.1. Company Overview
133.3.14.2. Business Portfolio
133.3.14.3. Financials
133.3.14.4. Geographical Footprint
133.3.14.5. SWOT Analysis
133.3.14.6. Recent Developments and Strategies
133.3.15. Others
134. Appendix
- Get Started -
Get insights that lead to new growth opportunities
- Talk to Experts -
Get answers to your queries on this report from our experts
Frequently Asked Questions
The global PFAS Alternatives market in 2025 was $US 4.15 Billion.
The global PFAS Alternatives market will be $US 16.2 Billion by 2036.
The expected growth rate (CAGR%) of the global PFAS Alternatives market is 11.9% for the period 2026-2036.
Regulatory Phase-Out Mandates are Forcing Time-Bound Substitution across Major Markets and Brand and Retailer Sustainability Commitments are Accelerating Voluntary Substitution in Packaging and Textiles.
Silicone-based Polymers was the largest segment in product type holding more than 30% share among all in PFAS Alternatives Market in 2025.
North America was the leading regions for PFAS Alternatives holding 36% of the global market in 2025.
Chemours, DuPont, Daikin Industries, Solvay, Archroma, Huntsman Corporation, Dow Inc., Rudolf Group, Saint-Gobain, Shin-Etsu Chemical, Evonik Industries, Mitsui Chemicals, Victrex, Avient Corporation, Trinseo and Others.