
Global OPGW Cables Market
OPGW Cables Market (Type: Layer Stranding, Central Tube, Unitube; Structure Type: Central Loose Tube, Multi Loose Tube; Fiber Count: Upto 24, 24 – 48, 48 – 72, 72 – 108, Above 108; Short Current Capacity: Upto 50 kA2s, 50 kA2s – 100 kA2s, 100 kA2s – 150 kA2s, 150 kA2s – 200 kA2s, Above 200 kA2s; End Use Industry: Transportation, Oil and Gas, Telecommunication, Power Utilities, Others) – Global Industry Analysis, Shares, Growth, Trends and Forecast 2021-2036
Categories:
All, Chemicals and Materials, Electronics and Semiconductor
| Format: PDF/PPT/Excel
| Product ID:
4361
| Report Version:
April 2026
- Report Preview
- Table of Content
- Request Customization
Market Snappshot
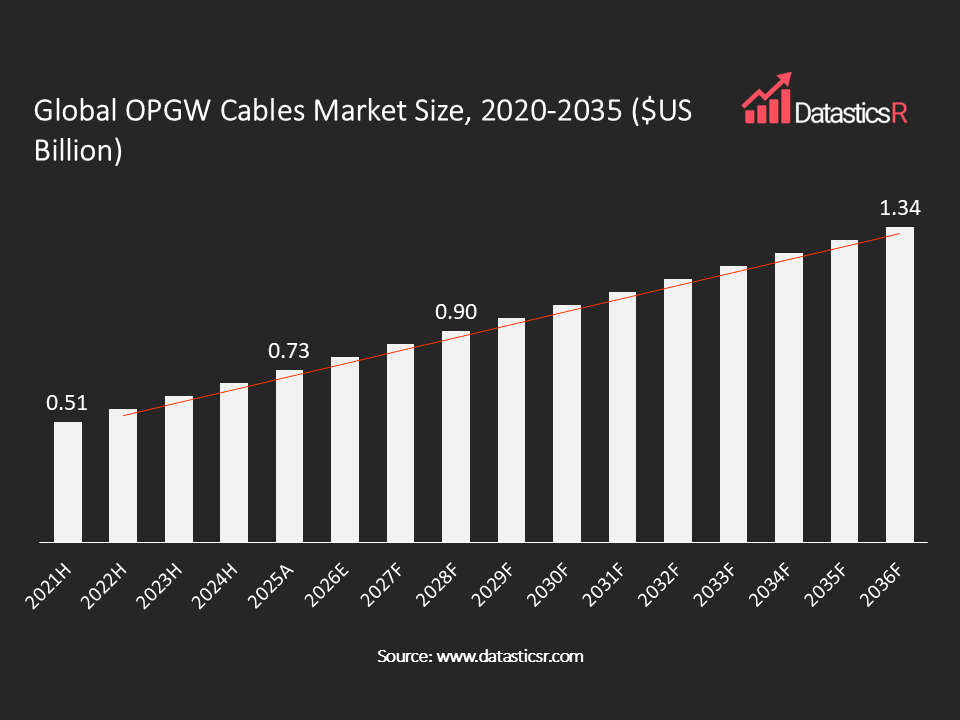
- Market Size in 2025: $US 0.732 Bn
- Forecast Market by 2036: $US 1.34 Bn
- CAGR for the Period 2026-2036: 5.5%
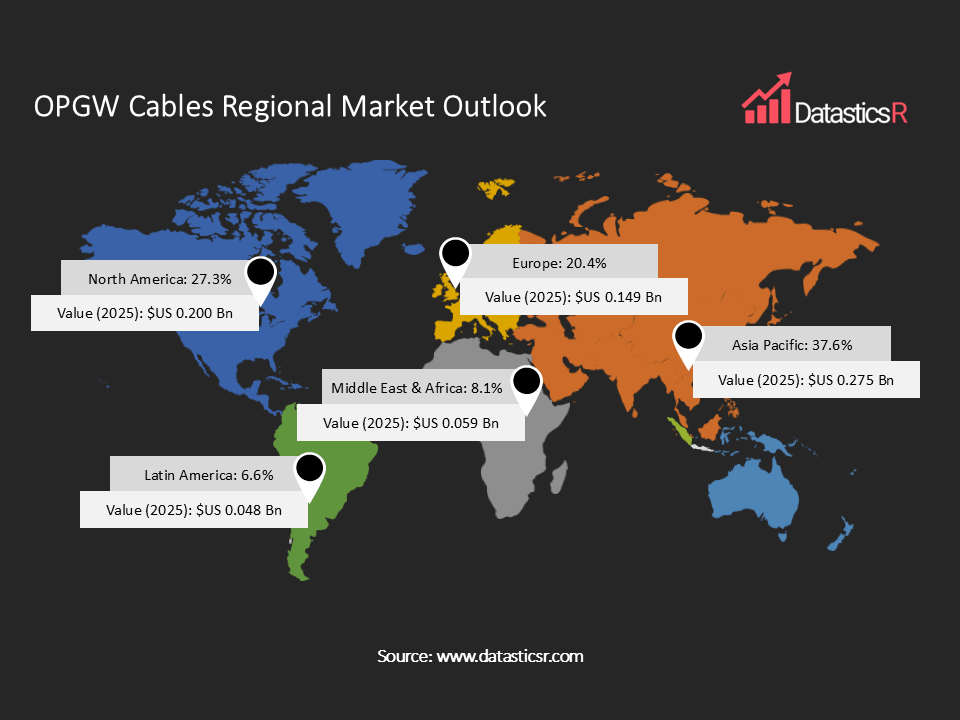
- Top Region in Terms of Market Share: Asia Pacific (37.6%)
- Key Players: Prysmian Group, Nexans S.A., Fujikura Ltd., LS Cable & System Ltd., Sumitomo Electric Industries Ltd., ZTT Group, Hengtong Group, Furukawa Electric Co. Ltd., Taihan Electric Wire Co. Ltd., Elsewedy Electric, Sterlite Technologies Ltd., and Others
Analyst Viewpoint:
OPGW cables market is experiencing growth due to significant investments in the power transmission sector as well as improvement in grid networks. With fiber-optic communications incorporated in high voltage transmission lines, OPGW cables become a necessary technology for real time monitoring, failure detection, and smart grid operations. The two-in-one grounding and communication functions make OPGW cables more efficient and reliable in comparison with traditional alternatives. OPGW cables are highly demanded in emerging countries considering the expansion of electricity grids and development of renewable energy sources. However, there are some issues that impact OPGW cables market including high installation costs and reliance on power utility investment projects. Development of better technology, increased number of fibers per cable, as well as higher short-circuit capacities improve product quality. In the future, the growth of smart grid systems, digital substations, and high voltage transmission projects will continue to positively influence OPGW cables market.
OPGW Cables Market Overview:
The latest trend is towards using the OPGW cables that provide the possibility of combining the processes of grounding and high-speed communication into one cable line. Such cables allow implementing reliable protection against lightning strikes while transmitting real-time data for monitoring and controlling the grid. Layer stranded products were widely adopted with a market share of 56.6% in 2025 thanks to mechanical robustness and the ability to use in high-voltage and extra-high voltage grids. On the other hand, central tube and unitube OPGW cables are increasingly used in medium voltage grids owing to compactness and affordable price. As for the structure, central loose tubes are used for low fiber count, while multi loose tubes are used for high fiber count and high reliability of cables. An increasing demand for fiber counts in OPGW cables stems from the increased need to transmit large volumes of data required by modern grids to increase their lifespan. The International Energy Agency stated that digital technologies could save USD 1.8 trillion of grid investments until 2050 by prolonging the lifetime of grids. End-users in the power sector dominate the market for OPGW cables owing to expansion of grids and renewables adoption.
| Drivers | Expansion Of Power Transmission Infrastructure and Smart Grid Deployment |
| Increasing Integration of Fiber-Optic Communication in Utility Networks |
Expansion Of Power Transmission Infrastructure and Smart Grid Deployment
Growing development of the power transmission networks plays an important role in boosting the sales volume of OPGW cables. In 2025 global electricity consumption exceeds 28,200 TWh, and is expected to reach 33,600 TWh by 2030. The growing demands from energy consumers make utilities to upgrade existing grid infrastructures and build new ones. In addition, OPGW cables provide two functions that allow reducing costs for building infrastructure up to 20-25%, improving its performance and increasing its reliability. These features make OPGW cables necessary for the further expansion of power transmission networks. Also, OPGW cables are gaining popularity due to the widespread introduction of smart grid technologies across the world. To ensure smooth operation of a smart grid, there is a need in real-time control over its performance, which can be achieved using OPGW cables. As per DatasticsR findings, the percentage of expenses on modernizing power transmission networks allocated to digital and fiber infrastructures reached more than 40%.
Increasing Integration of Fiber-Optic Communication in Utility Networks
The growing demand for rapid and reliable communication over power grids is one of the drivers that promotes the implementation of Optical Ground Wire (OPGW) cables. Contemporary electric grids rely on timely exchange of data for performing certain tasks related to balancing loads, handling outages, and managing protection systems. According to the International Telecommunication Union, in 2025, 74 percent of the global population was online, compared with 71 percent in 2024. These figures represented approximately 6 billion Internet users in 2025, increasing from 5.8 billion in 2024. Moreover, there is an increasing trend towards sharing infrastructure by utilities and telecommunication companies. The World Bank suggests that laying fiber optic cables along the power grid can save considerable money on the construction and installation of networks, and help deliver faster broadband services in isolated areas. OPGW cables are able to provide both electricity and communication capabilities since optical fibers are included directly into power lines. Thus, there is no need to build additional facilities for providing telecommunications.
OPGW Cables Regional Market Outlook:
Asia Pacific leads in the market for OPGW cables with around 37.6% market share owing to significant advancements in the transmission networks and rising investments in smart grids in emerging economies like China and India. North America is second with nearly 27.3% share due to the presence of key players operating in this region along with initiatives for network modernization in utilities. Europe is third in terms of share with nearly 20.4% share due to renewable energy integration and regulatory compliance with energy efficiency standards. Middle East & Africa is contributing approximately 8.1% market share due to infrastructure developments in the power sector. Latin America contributes around 6.6% market share in the global market.
Key Companies in OPGW Cables Market:
The OPGW cables market can be characterized as somewhat fragmented, where both global players and regional firms participate in the competition based on the quality, number of fibers, and efficiency of their products. The main areas of interest for most companies are the development of innovative and efficient products with higher performance and more fibers. Key players Prysmian Group, Nexans S.A., Fujikura Ltd., LS Cable & System Ltd., Sumitomo Electric Industries Ltd., ZTT Group, Hengtong Group, Furukawa Electric Co. Ltd., Taihan Electric Wire Co. Ltd., Elsewedy Electric, Sterlite Technologies Ltd., and Others.
Key Developments in OPGW Cables Market:
| 1. Sterlite Power secures new orders worth INR 1200 crores in Q2 FY’25: In November 2024, Sterlite Power secures INR 1,200 crore orders for GPS business, including India’s first 144-fiber OPGW cable, high-performance conductors, and MV-HV-EHV power cables, strengthening global and domestic market leadership. |
| 2. Sterlite Power acquires 65% stake in MTCIL JV: In April 2022, Sterlite Power announced acquisition of 64.98% equity stake in Maharashtra Transmission Communication Infrastructure Limited (MTCIL), a joint venture with Maharashtra State Electricity Transmission Company Limited (MSETCL). |
OPGW Cables Market Attributes:
| ATTRIBUTE | DETAILS |
| Market Value, 2025 | $US 0.732 Billion |
| Forecasted Market Value, 2036 | $US 1.34 Billion |
| CAGR (2026-2036) | 5.5% |
| Analysis Period | 2021-2036 |
| Historic Period | 2021-2024 |
| Base Year | 2025 |
| Forecast Period | 2026-2036 |
| Volume Unit | Kms |
| Value Unit | $US Billion |
| Market Segmentation | By Type
By Structure Type
By Fiber Count
By Short Current Capacity
By End Use Industry
By Region
|
| Companies Profiles |
|
| Customization Request | Available upon request |
1. Introduction
1.1. Report Scope
1.2. Market Segmentations and Definitions
1.3. Geographical Coverage
2. Executive Summary
2.1. Key Facts and Figures
2.2. Trends Impacting the Market
2.3. DatasticsR Growth Opportunity Matrix
3. Market Overview
3.1. Global OPGW Cables Market Analysis and Forecast, 2021-2036
3.1.1. Global OPGW Cables Market Size (Kms)
3.1.2. Global OPGW Cables Market Size ($US Bn)
3.2. Supply-side and Demand-side Trends
3.3. Technology Roadmap and Developments
3.4. Market Dynamics
3.4.1. Drivers
3.4.2. Restraints
3.4.3. Opportunities
3.5. Porter’s Five Forces Analysis
3.6. PESTL Analysis
3.7. Industry SWOT Analysis
3.8. Regulatory Landscape
3.9. Value Chain Analysis
3.9.1. List of Component Suppliers
3.9.2. List of Manufacturing Companies
3.9.3. List of Dealers/Distributors
3.9.4. List of Potential Customers
3.10. Impact of Current Geopolitical Scenario on the Market
4. Technical Analysis
4.1. Product Specification Analysis
4.2. Details of Production Process
4.3. Technology Adoption and Emerging Technologies
4.4. R&D Trends and Patents Landscape
4.5. Cost Structure and Profitability Analysis
5. Global Installation Analysis (Kms), by Region, 2025
5.1. North America
5.2. Europe
5.3. Asia Pacific
5.4. Latin America
5.5. Middle East and Africa
6. Import-export Analysis Volume (Kms) and Value ($US Bn), by Key Country, 2021-2025
7. Price Trend Analysis and Forecasting ($US/ Km), 2021-2036
7.1. Price Trend Analysis and Forecasting, by Type
7.2. Price Trend Analysis and Forecasting, by Fiber Count
7.3. Price Trend Analysis and Forecasting, by Region
8. Global OPGW Cables Market Analysis and Forecasting (Kms) ($US Bn), by Type, 2021-2036
9. Global OPGW Cables Market Analysis and Forecasting (Kms) ($US Bn), by Structure Type, 2021-2036
10. Global OPGW Cables Market Analysis and Forecasting (Kms) ($US Bn), by Fiber Count, 2021-2036
11. Global OPGW Cables Market Analysis and Forecasting (Kms) ($US Bn), by Short Current Capacity, 2021-2036
12. Global OPGW Cables Market Analysis and Forecasting (Kms) ($US Bn), by End Use Industry, 2021-2036
13. Global OPGW Cables Market Analysis and Forecasting (Kms) ($US Bn), by Region, 2021-2036
14. North America OPGW Cables Market Analysis and Forecasting (Kms) ($US Bn), by Type, 2021-2036
15. North America OPGW Cables Market Analysis and Forecasting (Kms) ($US Bn), by Structure Type, 2021-2036
16. North America OPGW Cables Market Analysis and Forecasting (Kms) ($US Bn), by Fiber Count, 2021-2036
17. North America OPGW Cables Market Analysis and Forecasting (Kms) ($US Bn), by Short Current Capacity, 2021-2036
18. North America OPGW Cables Market Analysis and Forecasting (Kms) ($US Bn), by End Use Industry, 2021-2036
19. U.S. OPGW Cables Market Analysis and Forecasting (Kms) ($US Bn), by Type, 2021-2036
20. U.S. OPGW Cables Market Analysis and Forecasting (Kms) ($US Bn), by Structure Type, 2021-2036
21. U.S. OPGW Cables Market Analysis and Forecasting (Kms) ($US Bn), by Fiber Count, 2021-2036
22. U.S. OPGW Cables Market Analysis and Forecasting (Kms) ($US Bn), by Short Current Capacity, 2021-2036
23. U.S. OPGW Cables Market Analysis and Forecasting (Kms) ($US Bn), by End Use Industry, 2021-2036
24. Canada OPGW Cables Market Analysis and Forecasting (Kms) ($US Bn), by Type, 2021-2036
25. Canada OPGW Cables Market Analysis and Forecasting (Kms) ($US Bn), by Structure Type, 2021-2036
26. Canada OPGW Cables Market Analysis and Forecasting (Kms) ($US Bn), by Fiber Count, 2021-2036
27. Canada OPGW Cables Market Analysis and Forecasting (Kms) ($US Bn), by Short Current Capacity, 2021-2036
28. Canada OPGW Cables Market Analysis and Forecasting (Kms) ($US Bn), by End Use Industry, 2021-2036
29. Europe OPGW Cables Market Analysis and Forecasting (Kms) ($US Bn), by Type, 2021-2036
30. Europe OPGW Cables Market Analysis and Forecasting (Kms) ($US Bn), by Structure Type, 2021-2036
31. Europe OPGW Cables Market Analysis and Forecasting (Kms) ($US Bn), by Fiber Count, 2021-2036
32. Europe OPGW Cables Market Analysis and Forecasting (Kms) ($US Bn), by Short Current Capacity, 2021-2036
33. Europe OPGW Cables Market Analysis and Forecasting (Kms) ($US Bn), by End Use Industry, 2021-2036
34. Germany OPGW Cables Market Analysis and Forecasting (Kms) ($US Bn), by Type, 2021-2036
35. Germany OPGW Cables Market Analysis and Forecasting (Kms) ($US Bn), by Structure Type, 2021-2036
36. Germany OPGW Cables Market Analysis and Forecasting (Kms) ($US Bn), by Fiber Count, 2021-2036
37. Germany OPGW Cables Market Analysis and Forecasting (Kms) ($US Bn), by Short Current Capacity, 2021-2036
38. Germany OPGW Cables Market Analysis and Forecasting (Kms) ($US Bn), by End Use Industry, 2021-2036
39. U.K. OPGW Cables Market Analysis and Forecasting (Kms) ($US Bn), by Type, 2021-2036
40. U.K. OPGW Cables Market Analysis and Forecasting (Kms) ($US Bn), by Structure Type, 2021-2036
41. U.K. OPGW Cables Market Analysis and Forecasting (Kms) ($US Bn), by Fiber Count, 2021-2036
42. U.K. OPGW Cables Market Analysis and Forecasting (Kms) ($US Bn), by Short Current Capacity, 2021-2036
43. U.K. OPGW Cables Market Analysis and Forecasting (Kms) ($US Bn), by End Use Industry, 2021-2036
44. France OPGW Cables Market Analysis and Forecasting (Kms) ($US Bn), by Type, 2021-2036
45. France OPGW Cables Market Analysis and Forecasting (Kms) ($US Bn), by Structure Type, 2021-2036
46. France OPGW Cables Market Analysis and Forecasting (Kms) ($US Bn), by Fiber Count, 2021-2036
47. France OPGW Cables Market Analysis and Forecasting (Kms) ($US Bn), by Short Current Capacity, 2021-2036
48. France OPGW Cables Market Analysis and Forecasting (Kms) ($US Bn), by End Use Industry, 2021-2036
49. Italy OPGW Cables Market Analysis and Forecasting (Kms) ($US Bn), by Type, 2021-2036
50. Italy OPGW Cables Market Analysis and Forecasting (Kms) ($US Bn), by Structure Type, 2021-2036
51. Italy OPGW Cables Market Analysis and Forecasting (Kms) ($US Bn), by Fiber Count, 2021-2036
52. Italy OPGW Cables Market Analysis and Forecasting (Kms) ($US Bn), by Short Current Capacity, 2021-2036
53. Italy OPGW Cables Market Analysis and Forecasting (Kms) ($US Bn), by End Use Industry, 2021-2036
54. Spain OPGW Cables Market Analysis and Forecasting (Kms) ($US Bn), by Type, 2021-2036
55. Spain OPGW Cables Market Analysis and Forecasting (Kms) ($US Bn), by Structure Type, 2021-2036
56. Spain OPGW Cables Market Analysis and Forecasting (Kms) ($US Bn), by Fiber Count, 2021-2036
57. Spain OPGW Cables Market Analysis and Forecasting (Kms) ($US Bn), by Short Current Capacity, 2021-2036
58. Spain OPGW Cables Market Analysis and Forecasting (Kms) ($US Bn), by End Use Industry, 2021-2036
59. Russia & CIS OPGW Cables Market Analysis and Forecasting (Kms) ($US Bn), by Type, 2021-2036
60. Russia & CIS OPGW Cables Market Analysis and Forecasting (Kms) ($US Bn), by Structure Type, 2021-2036
61. Russia & CIS OPGW Cables Market Analysis and Forecasting (Kms) ($US Bn), by Fiber Count, 2021-2036
62. Russia & CIS OPGW Cables Market Analysis and Forecasting (Kms) ($US Bn), by Short Current Capacity, 2021-2036
63. Russia & CIS OPGW Cables Market Analysis and Forecasting (Kms) ($US Bn), by End Use Industry, 2021-2036
64. Rest of Europe OPGW Cables Market Analysis and Forecasting (Kms) ($US Bn), by Type, 2021-2036
65. Rest of Europe OPGW Cables Market Analysis and Forecasting (Kms) ($US Bn), by Structure Type, 2021-2036
66. Rest of Europe OPGW Cables Market Analysis and Forecasting (Kms) ($US Bn), by Fiber Count, 2021-2036
67. Rest of Europe OPGW Cables Market Analysis and Forecasting (Kms) ($US Bn), by Short Current Capacity, 2021-2036
68. Rest of Europe OPGW Cables Market Analysis and Forecasting (Kms) ($US Bn), by End Use Industry, 2021-2036
69. Asia Pacific OPGW Cables Market Analysis and Forecasting (Kms) ($US Bn), by Type, 2021-2036
70. Asia Pacific OPGW Cables Market Analysis and Forecasting (Kms) ($US Bn), by Structure Type, 2021-2036
71. Asia Pacific OPGW Cables Market Analysis and Forecasting (Kms) ($US Bn), by Fiber Count, 2021-2036
72. Asia Pacific OPGW Cables Market Analysis and Forecasting (Kms) ($US Bn), by Short Current Capacity, 2021-2036
73. Asia Pacific OPGW Cables Market Analysis and Forecasting (Kms) ($US Bn), by End Use Industry, 2021-2036
74. China OPGW Cables Market Analysis and Forecasting (Kms) ($US Bn), by Type, 2021-2036
75. China OPGW Cables Market Analysis and Forecasting (Kms) ($US Bn), by Structure Type, 2021-2036
76. China OPGW Cables Market Analysis and Forecasting (Kms) ($US Bn), by Fiber Count, 2021-2036
77. China OPGW Cables Market Analysis and Forecasting (Kms) ($US Bn), by Short Current Capacity, 2021-2036
78. China OPGW Cables Market Analysis and Forecasting (Kms) ($US Bn), by End Use Industry, 2021-2036
79. India OPGW Cables Market Analysis and Forecasting (Kms) ($US Bn), by Type, 2021-2036
80. India OPGW Cables Market Analysis and Forecasting (Kms) ($US Bn), by Structure Type, 2021-2036
81. India OPGW Cables Market Analysis and Forecasting (Kms) ($US Bn), by Fiber Count, 2021-2036
82. India OPGW Cables Market Analysis and Forecasting (Kms) ($US Bn), by Short Current Capacity, 2021-2036
83. India OPGW Cables Market Analysis and Forecasting (Kms) ($US Bn), by End Use Industry, 2021-2036
84. Japan OPGW Cables Market Analysis and Forecasting (Kms) ($US Bn), by Type, 2021-2036
85. Japan OPGW Cables Market Analysis and Forecasting (Kms) ($US Bn), by Structure Type, 2021-2036
86. Japan OPGW Cables Market Analysis and Forecasting (Kms) ($US Bn), by Fiber Count, 2021-2036
87. Japan OPGW Cables Market Analysis and Forecasting (Kms) ($US Bn), by Short Current Capacity, 2021-2036
88. Japan OPGW Cables Market Analysis and Forecasting (Kms) ($US Bn), by End Use Industry, 2021-2036
89. South Korea OPGW Cables Market Analysis and Forecasting (Kms) ($US Bn), by Type, 2021-2036
90. South Korea OPGW Cables Market Analysis and Forecasting (Kms) ($US Bn), by Structure Type, 2021-2036
91. South Korea OPGW Cables Market Analysis and Forecasting (Kms) ($US Bn), by Fiber Count, 2021-2036
92. South Korea OPGW Cables Market Analysis and Forecasting (Kms) ($US Bn), by Short Current Capacity, 2021-2036
93. South Korea OPGW Cables Market Analysis and Forecasting (Kms) ($US Bn), by End Use Industry, 2021-2036
94. Taiwan OPGW Cables Market Analysis and Forecasting (Kms) ($US Bn), by Type, 2021-2036
95. Taiwan OPGW Cables Market Analysis and Forecasting (Kms) ($US Bn), by Structure Type, 2021-2036
96. Taiwan OPGW Cables Market Analysis and Forecasting (Kms) ($US Bn), by Fiber Count, 2021-2036
97. Taiwan OPGW Cables Market Analysis and Forecasting (Kms) ($US Bn), by Short Current Capacity, 2021-2036
98. Taiwan OPGW Cables Market Analysis and Forecasting (Kms) ($US Bn), by End Use Industry, 2021-2036
99. Australia OPGW Cables Market Analysis and Forecasting (Kms) ($US Bn), by Type, 2021-2036
100. Australia OPGW Cables Market Analysis and Forecasting (Kms) ($US Bn), by Structure Type, 2021-2036
101. Australia OPGW Cables Market Analysis and Forecasting (Kms) ($US Bn), by Fiber Count, 2021-2036
102. Australia OPGW Cables Market Analysis and Forecasting (Kms) ($US Bn), by Short Current Capacity, 2021-2036
103. Australia OPGW Cables Market Analysis and Forecasting (Kms) ($US Bn), by End Use Industry, 2021-2036
104. ASEAN OPGW Cables Market Analysis and Forecasting (Kms) ($US Bn), by Type, 2021-2036
105. ASEAN OPGW Cables Market Analysis and Forecasting (Kms) ($US Bn), by Structure Type, 2021-2036
106. ASEAN OPGW Cables Market Analysis and Forecasting (Kms) ($US Bn), by Fiber Count, 2021-2036
107. ASEAN OPGW Cables Market Analysis and Forecasting (Kms) ($US Bn), by Short Current Capacity, 2021-2036
108. ASEAN OPGW Cables Market Analysis and Forecasting (Kms) ($US Bn), by End Use Industry, 2021-2036
109. Rest of Asia Pacific OPGW Cables Market Analysis and Forecasting (Kms) ($US Bn), by Type, 2021-2036
110. Rest of Asia Pacific OPGW Cables Market Analysis and Forecasting (Kms) ($US Bn), by Structure Type, 2021-2036
111. Rest of Asia Pacific OPGW Cables Market Analysis and Forecasting (Kms) ($US Bn), by Fiber Count, 2021-2036
112. Rest of Asia Pacific OPGW Cables Market Analysis and Forecasting (Kms) ($US Bn), by Short Current Capacity, 2021-2036
113. Rest of Asia Pacific OPGW Cables Market Analysis and Forecasting (Kms) ($US Bn), by End Use Industry, 2021-2036
114. Latin America OPGW Cables Market Analysis and Forecasting (Kms) ($US Bn), by Type, 2021-2036
115. Latin America OPGW Cables Market Analysis and Forecasting (Kms) ($US Bn), by Structure Type, 2021-2036
116. Latin America OPGW Cables Market Analysis and Forecasting (Kms) ($US Bn), by Fiber Count, 2021-2036
117. Latin America OPGW Cables Market Analysis and Forecasting (Kms) ($US Bn), by Short Current Capacity, 2021-2036
118. Latin America OPGW Cables Market Analysis and Forecasting (Kms) ($US Bn), by End Use Industry, 2021-2036
119. Brazil OPGW Cables Market Analysis and Forecasting (Kms) ($US Bn), by Type, 2021-2036
120. Brazil OPGW Cables Market Analysis and Forecasting (Kms) ($US Bn), by Structure Type, 2021-2036
121. Brazil OPGW Cables Market Analysis and Forecasting (Kms) ($US Bn), by Fiber Count, 2021-2036
122. Brazil OPGW Cables Market Analysis and Forecasting (Kms) ($US Bn), by Short Current Capacity, 2021-2036
123. Brazil OPGW Cables Market Analysis and Forecasting (Kms) ($US Bn), by End Use Industry, 2021-2036
124. Mexico OPGW Cables Market Analysis and Forecasting (Kms) ($US Bn), by Type, 2021-2036
125. Mexico OPGW Cables Market Analysis and Forecasting (Kms) ($US Bn), by Structure Type, 2021-2036
126. Mexico OPGW Cables Market Analysis and Forecasting (Kms) ($US Bn), by Fiber Count, 2021-2036
127. Mexico OPGW Cables Market Analysis and Forecasting (Kms) ($US Bn), by Short Current Capacity, 2021-2036
128. Mexico OPGW Cables Market Analysis and Forecasting (Kms) ($US Bn), by End Use Industry, 2021-2036
129. Argentina OPGW Cables Market Analysis and Forecasting (Kms) ($US Bn), by Type, 2021-2036
130. Argentina OPGW Cables Market Analysis and Forecasting (Kms) ($US Bn), by Structure Type, 2021-2036
131. Argentina OPGW Cables Market Analysis and Forecasting (Kms) ($US Bn), by Fiber Count, 2021-2036
132. Argentina OPGW Cables Market Analysis and Forecasting (Kms) ($US Bn), by Short Current Capacity, 2021-2036
133. Argentina OPGW Cables Market Analysis and Forecasting (Kms) ($US Bn), by End Use Industry, 2021-2036
134. Rest of Latin America OPGW Cables Market Analysis and Forecasting (Kms) ($US Bn), by Type, 2021-2036
135. Rest of Latin America OPGW Cables Market Analysis and Forecasting (Kms) ($US Bn), by Structure Type, 2021-2036
136. Rest of Latin America OPGW Cables Market Analysis and Forecasting (Kms) ($US Bn), by Fiber Count, 2021-2036
137. Rest of Latin America OPGW Cables Market Analysis and Forecasting (Kms) ($US Bn), by Short Current Capacity, 2021-2036
138. Rest of Latin America OPGW Cables Market Analysis and Forecasting (Kms) ($US Bn), by End Use Industry, 2021-2036
139. Middle East & Africa OPGW Cables Market Analysis and Forecasting (Kms) ($US Bn), by Type, 2021-2036
140. Middle East & Africa OPGW Cables Market Analysis and Forecasting (Kms) ($US Bn), by Structure Type, 2021-2036
141. Middle East & Africa OPGW Cables Market Analysis and Forecasting (Kms) ($US Bn), by Fiber Count, 2021-2036
142. Middle East & Africa OPGW Cables Market Analysis and Forecasting (Kms) ($US Bn), by Short Current Capacity, 2021-2036
143. Middle East & Africa OPGW Cables Market Analysis and Forecasting (Kms) ($US Bn), by End Use Industry, 2021-2036
144. Saudi Arabia OPGW Cables Market Analysis and Forecasting (Kms) ($US Bn), by Type, 2021-2036
145. Saudi Arabia OPGW Cables Market Analysis and Forecasting (Kms) ($US Bn), by Structure Type, 2021-2036
146. Saudi Arabia OPGW Cables Market Analysis and Forecasting (Kms) ($US Bn), by Fiber Count, 2021-2036
147. Saudi Arabia OPGW Cables Market Analysis and Forecasting (Kms) ($US Bn), by Short Current Capacity, 2021-2036
148. Saudi Arabia OPGW Cables Market Analysis and Forecasting (Kms) ($US Bn), by End Use Industry, 2021-2036
149. UAE OPGW Cables Market Analysis and Forecasting (Kms) ($US Bn), by Type, 2021-2036
150. UAE OPGW Cables Market Analysis and Forecasting (Kms) ($US Bn), by Structure Type, 2021-2036
151. UAE OPGW Cables Market Analysis and Forecasting (Kms) ($US Bn), by Fiber Count, 2021-2036
152. UAE OPGW Cables Market Analysis and Forecasting (Kms) ($US Bn), by Short Current Capacity, 2021-2036
153. UAE OPGW Cables Market Analysis and Forecasting (Kms) ($US Bn), by End Use Industry, 2021-2036
154. South Africa OPGW Cables Market Analysis and Forecasting (Kms) ($US Bn), by Type, 2021-2036
155. South Africa OPGW Cables Market Analysis and Forecasting (Kms) ($US Bn), by Structure Type, 2021-2036
156. South Africa OPGW Cables Market Analysis and Forecasting (Kms) ($US Bn), by Fiber Count, 2021-2036
157. South Africa OPGW Cables Market Analysis and Forecasting (Kms) ($US Bn), by Short Current Capacity, 2021-2036
158. South Africa OPGW Cables Market Analysis and Forecasting (Kms) ($US Bn), by End Use Industry, 2021-2036
159. Rest of Middle East & Africa OPGW Cables Market Analysis and Forecasting (Kms) ($US Bn), by Type, 2021-2036
160. Rest of Middle East & Africa OPGW Cables Market Analysis and Forecasting (Kms) ($US Bn), by Structure Type, 2021-2036
161. Rest of Middle East & Africa OPGW Cables Market Analysis and Forecasting (Kms) ($US Bn), by Fiber Count, 2021-2036
162. Rest of Middle East & Africa OPGW Cables Market Analysis and Forecasting (Kms) ($US Bn), by Short Current Capacity, 2021-2036
163. Rest of Middle East & Africa OPGW Cables Market Analysis and Forecasting (Kms) ($US Bn), by End Use Industry, 2021-2036
164. Competition Landscape
164.1. Market Share Analysis (%), by Company, 2025
164.2. Competitive Benchmarking
164.3. Company Profiles
164.3.1. Prysmian Group
164.3.1.1. Company Overview
164.3.1.2. Product Portfolio
164.3.1.3. Financials
164.3.1.4. Geographical Footprint
164.3.1.5. SWOT Analysis
164.3.1.6. Recent Developments and Strategies
164.3.2. Nexans S.A.
164.3.2.1. Company Overview
164.3.2.2. Product Portfolio
164.3.2.3. Financials
164.3.2.4. Geographical Footprint
164.3.2.5. SWOT Analysis
164.3.2.6. Recent Developments and Strategies
164.3.3. Fujikura Ltd.
164.3.3.1. Company Overview
164.3.3.2. Product Portfolio
164.3.3.3. Financials
164.3.3.4. Geographical Footprint
164.3.3.5. SWOT Analysis
164.3.3.6. Recent Developments and Strategies
164.3.4. LS Cable & System Ltd.
164.3.4.1. Company Overview
164.3.4.2. Product Portfolio
164.3.4.3. Financials
164.3.4.4. Geographical Footprint
164.3.4.5. SWOT Analysis
164.3.4.6. Recent Developments and Strategies
164.3.5. Sumitomo Electric Industries Ltd.
164.3.5.1. Company Overview
164.3.5.2. Product Portfolio
164.3.5.3. Financials
164.3.5.4. Geographical Footprint
164.3.5.5. SWOT Analysis
164.3.5.6. Recent Developments and Strategies
164.3.6. ZTT Group
164.3.6.1. Company Overview
164.3.6.2. Product Portfolio
164.3.6.3. Financials
164.3.6.4. Geographical Footprint
164.3.6.5. SWOT Analysis
164.3.6.6. Recent Developments and Strategies
164.3.7. Hengtong Group
164.3.7.1. Company Overview
164.3.7.2. Product Portfolio
164.3.7.3. Financials
164.3.7.4. Geographical Footprint
164.3.7.5. SWOT Analysis
164.3.7.6. Recent Developments and Strategies
164.3.8. Furukawa Electric Co. Ltd.
164.3.8.1. Company Overview
164.3.8.2. Product Portfolio
164.3.8.3. Financials
164.3.8.4. Geographical Footprint
164.3.8.5. SWOT Analysis
164.3.8.6. Recent Developments and Strategies
164.3.9. Taihan Electric Wire Co. Ltd.
164.3.9.1. Company Overview
164.3.9.2. Product Portfolio
164.3.9.3. Financials
164.3.9.4. Geographical Footprint
164.3.9.5. SWOT Analysis
164.3.9.6. Recent Developments and Strategies
164.3.10. Elsewedy Electric
164.3.10.1. Company Overview
164.3.10.2. Product Portfolio
164.3.10.3. Financials
164.3.10.4. Geographical Footprint
164.3.10.5. SWOT Analysis
164.3.10.6. Recent Developments and Strategies
164.3.11. Sterlite Technologies Ltd.
164.3.11.1. Company Overview
164.3.11.2. Product Portfolio
164.3.11.3. Financials
164.3.11.4. Geographical Footprint
164.3.11.5. SWOT Analysis
164.3.11.6. Recent Developments and Strategies
164.3.12. Others
165. Appendix

- Get Started -
Get insights that lead to new growth opportunities
- Talk to Experts -
Get answers to your queries on this report from our experts
Frequently Asked Questions
The global OPGW Cables market in 2025 was $US 0.732 Billion.
The global OPGW Cables market will be $US 1.34 Billion by 2036.
The expected growth rate (CAGR%) of the global OPGW Cables market is 5.5% for the period 2026-2036.
Expansion Of Power Transmission Infrastructure and Smart Grid Deployment and Increasing Integration of Fiber-Optic Communication in Utility Networks.
Layer Stranding was the largest segment holding around 56.6% share among all in OPGW Cables Market in 2025.
Asia Pacific was the leading regions for OPGW Cables holding 37.6% of the global market in 2025.
Prysmian Group, Nexans S.A., Fujikura Ltd., LS Cable & System Ltd., Sumitomo Electric Industries Ltd., ZTT Group, Hengtong Group, Furukawa Electric Co. Ltd., Taihan Electric Wire Co. Ltd., Elsewedy Electric, Sterlite Technologies Ltd., and Others.