
Recycled Copper Market
Recycled Copper Market (Source – Scrap Copper, Copper Alloys Scrap, Copper Wires & Cables, Industrial Scrap, and Others; Grade – Bare Bright Copper, No.1 Copper, No.2 Copper, Insulated Copper Wire, and Others; Recycling Process – Mechanical Recycling, Electrolytic Refining, Hydrometallurgical Process, and Others; and End-use Industry) – Global Industry Analysis, Shares, Growth, Trends and Forecast 2020-2035
Categories:
All, Chemicals and Materials
| Format: PDF/PPT/Excel
| Product ID:
3758
| Report Version:
August 2025
- Report Preview
- Table of Content
- Request Customization
Market Snappshot
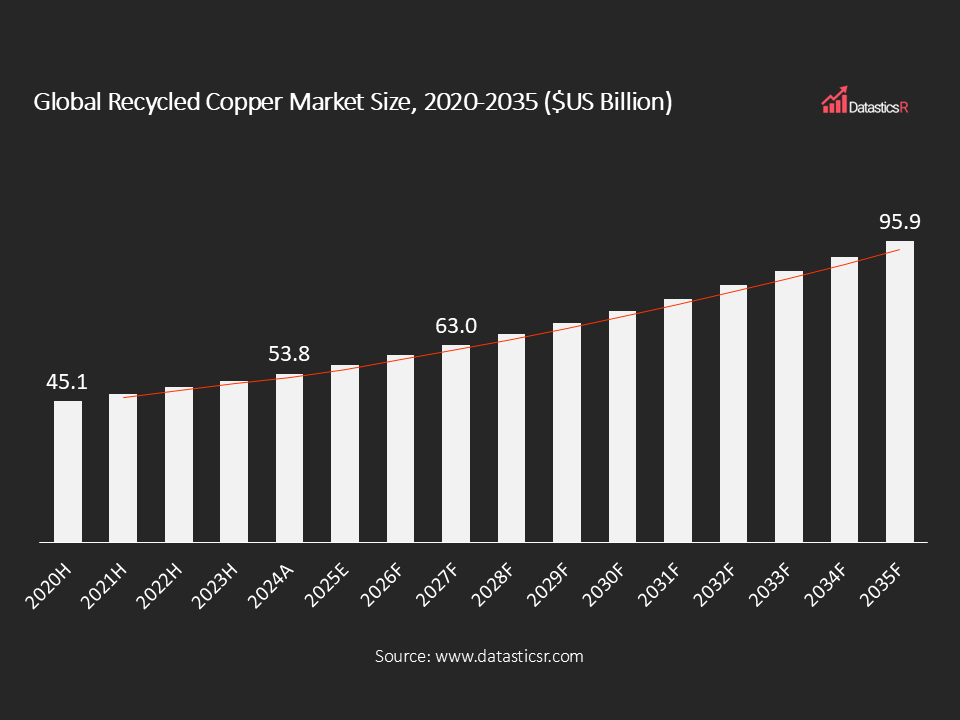
- Market Size in 2024: $US 53.8 Billion
- Forecast Market by 2035: $US 95.9 Billion
- CAGR for the Period 2025-2035: 5.4%
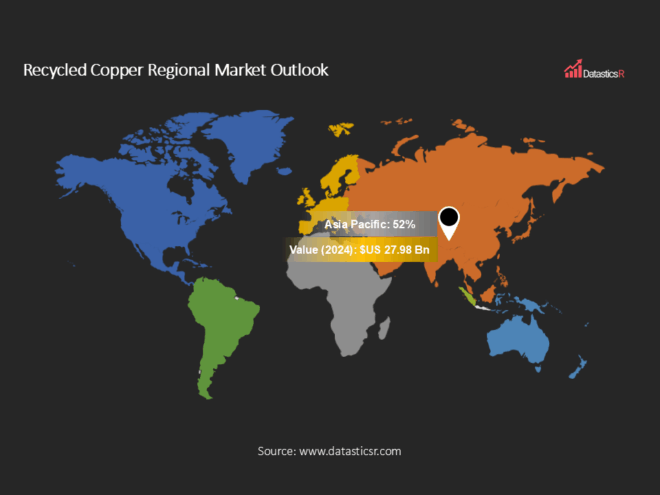
- Top Region in Terms of Market Share: Asia Pacific (52%)
- Key Players: Aurubis AG, Commercial Metals Company, Schnitzer Steel Industries, Inc., Umicore N.V., Kuusakoski Group Oy, Sims Metal Management Ltd., OmniSource, LLC, and Others.
Analyst Viewpoint:
The industry for copper recycling is extremely on the demand as governments and industries alike continue to place a great importance on the sustainable raw material acquisition. Copper possesses distinguishing features high conductivity, corrosion resistance, and recyclability without compromise of performance and stands in the lead as a leading energy transition and circular economy material. The market is supported by the growing demand in construction, renewable energy infrastructure, and electric vehicles (EV) sector where copper acts as a key enabler. Imperfections in scrap collection systems, volatile raw scrap prices, and government obstacles to cross-border waste commerce are still there to restrain market players.
Sophisticated recycling processes such as electrolytic refining and hydrometallurgy are gaining ground to enhance the recovery efficiency and purity, providing new avenues for applications of high quality in power systems and electronics. With India’s and China’s industrialization leading world consumption, Asia Pacific, the market is transforming from a volume-driven model to specialty copper recycling of high purity for future applications in green energy and electrification.
Recycled Copper Market Overview:
Recycled copper is copper extracted from scrap cable, end-of-life products, construction site waste, wiring, cables, and industrial scrap. In contrast to most materials, copper never loses its conductivity or mechanical properties even when recycled multiple times, a reason it ranks as one of the most sustainable metals available in the world economy. It is applied extensively in electrical wiring, motors, renewable energy systems, building construction, car wiring harnesses, and consumer electronics.
Production involving mechanical ripping, grading, electrolytic refining and hydrometallurgical processing depends on the grade and purity of requirements. Bare Bright Copper and No.1 high purity grade copper are commonly used in high-performance electronics and electrical power generation. Copper of lower purity is applied in construction, plumbing, and machinery.
In 2024, production rose modestly secondary copper output is expected to stand up 1.5–1.75% from 2023 but its portion of total refined output fell slightly, as a result of greater growth in primary production. As demand for copper is expected to grow by 30% by 2040 (IEA), recycled copper will be critical in bridging supply gaps due to limited mine capacity and environmental constraints on mining expansion. Further, recycled copper will be vital in filling supply gaps due to finite mine capacity and environmental limitations on mining expansion.
The challenges that face the industry are the growing complexity of scrap streams, high energy costs of electrolytic refining, and world-wide fluctuating scrap markets. However, industry players are investing more in advanced collection systems, automated scrap sorting systems, and in-plant recycling facilities in a bid to contain primary copper reliance. Enabling by stricter environmental regulations, circular economy strategies, and also mounting the pressures from environmental consciously industries, the recycled copper market is establishing itself as a backdrop for green industrial expansion worldwide.
| Drivers | Rising Demand from Renewable Energy and Electric Vehicles |
| Stringent Government Regulations and ESG Goals are Promoting Large-scale Copper Recycling |
Rising Demand from Renewable Energy and Electric Vehicles
The increasing demand from renewable energy systems and electric vehicles (EVs) is one of the most powerful growth drivers for the recycled copper market. EVs, the IEA says, draw about 83 kg of copper per vehicle, about four times as much as conventional internal combustion vehicles draw. This is in terms of copper used within batteries, motors, inverters, and charging infrastructure. As vehicle manufacturers make commitments to 100% electrification by 2035, copper intensity within the transport segment is set to quadruple. At the same time, installations of renewable energy such as solar PV farms, onshore and offshore wind farms, and massive battery storage installations also use high amounts of copper. Solar energy would require approximately 5.5 tons of copper for each megawatt (MW), while offshore wind turbines would consume nearly 8 tons per MW, as they contain a great deal of cabling and transformers.
Recycling copper provides a cost-effective and eco-friendly solution to this rising demand, especially when primary mining is confronted with declining ore grades, escalating costs, and more stringent environmental controls. Surprisingly, manufacturing recycled copper uses 65–85% less CO₂ emissions than the mining metal from ore, contributing to a decarbonization of the global in a very direct manner. Closing the material loop in the recycling of copper reduces reliance on new mining, besides defending supply chains amid volatile global markets. With electrification gaining speed, recycled copper would be a master key to securing safe material supply for the energy transition sector.
Stringent Government Regulations and ESG Goals are Promoting Large-scale Copper Recycling
The global green policies and circular economy models are driving increase in recycled copper business. Government and regulatory agencies are implementing tougher recycling standards with cutting resource dependency and landfill wastes. Within the European Union, the Circular Economy Action Plan sets more stringent recycling rates, bans e-waste landfilling, and promotes the recovery of strategic raw materials like copper. Within the United States, the Environmental Protection Agency (EPA) has expanded national e-waste collection and recycling initiatives while motivating businesses to adopt responsible recycling practices. Meanwhile, China’s “National Sword” policy has re-routed global scrap streams by restricting imports of low-grade waste, prompting industries to invest in domestic recycling infrastructure and advanced refining facilities.Recycled copper uses upto 85% less energy than primary production, and thus it has a significant role in climate mitigation measures and net-zero under the Paris Agreement. This is not only reducing carbon footprints but also offering great cost savings to manufacturers. At the same time, businesses are adopting ESG (Environmental, Social, and Governance) frameworks with serious focus on recycled inputs in supply chains. For example, carmakers and electronics makers are increasingly making commitments to purchasing metals with high recycled content.The World Bank estimates global solid waste to grow to 3.4 billion tons by 2050, offering a rich stream of end-of-life products and scrap metal for recycling. To take advantage of this opportunity, investments are increasing in automated scrap sorting, hydrometallurgical refining, and digital traceability systems. Overall, such efforts place recycled copper at the centerpiece of sustainable resource management, minimizing landfill reliance while fortifying circular economy initiatives.
Recycled Copper Regional Market Outlook:
Asia Pacific is the leader in recycled copper market with 52% share. The largest copper consumer in the world, China, drives demand with its construction boom, manufacturing sector, and green power projects. Growth is also driven further by India’s infrastructure push and EV rollout. India and Japan also significantly contribute to the overall regions market share
Europe has the second-highest market share fueled by robust EU recycling policies and robust take-up in automotive and renewable markets. Germany and Italy are at the forefront, which is facilitated by the developed recycling networks.
North America holds considerable market share by the United States through large e-waste recycling initiatives and robust take-up from EV and electronics industries. Policymaker favorability of the EPA boosts local recycling.
Latin America is becoming a hub for growth because of plenty of scrap and growing copper-intensive industries in Mexico and Brazil.
The Middle East & Africa lags but has potential as mine-based economies transition to recycling. South Africa and GCC countries are starting to put the investments in a circular economy practice, improving a regional growth prospect.
Key Companies in Recycled Copper Market:
The secondary copper market is relatively consolidated with the global leaders and local recyclers vying for scrap supply and technological prowess. Market leaders like Aurubis, Sims Metal, and Umicore are race-inflating sophisticated refining technology in an effort to meet growing demand for high-purity copper in electric vehicles and renewable energy. Strategic acquisitions, joint ventures, and automating scrap gathering remain among the top strategies to secure supply chains. Asian Pacific regional players are now being joined with downstream industries, facilitating cost savings and in-region access to recycled copper competitive advantages.Aurubis AG, Commercial Metals Company, Schnitzer Steel Industries, Inc., Umicore N.V., Kuusakoski Group Oy, Sims Metal Management Ltd., OmniSource, LLC, Elgin Recycling, Elgin Recycling, Pacific Metal Pty Ltd, Universal Recycling, Wilton Recycling, LKM Recycling, European Recycled Metal, SA Recycling LLC, Aaron Metals, and Others.
Key Developments in Recycled Copper Market:
| 1. Hindalco unveils $10 billion investment plan: In August 2025, Hindalco Industries announced nvestments worth $10 billion over the next five years across aluminium, copper, and speciality alumina, chairman Kumar Mangalam Birla told shareholders at the company’s 66th Annual General Meeting on Thursday. |
| 2. Aurubis to ramp up new US copper recycling facility: In April 2024, Aurubis announced ramping up of its copper recycling smelter in the U.S. Aurubus has invested $800 million building the project, which took four years. Haag said it will process 180,000 metric tons of complex copper scrap and produce 70,000 tons of refined metal annually. |
Recycled Copper Market Attributes:
| ATTRIBUTE | DETAILS |
| Market Value, 2024 | $US 53.8 Billion |
| Forecasted Market Value, 2035 | $US 95.9 Billion |
| CAGR (2025-2035) | 5.4% |
| Analysis Period | 2025-2035 |
| Historic Period | 2020-2023 |
| Base Year | 2024 |
| Forecast Period | 2025-2035 |
| Volume Unit | Tons |
| Value Unit | $US Billion |
| Market Segmentation | By Source
By Grade
By Recycling Process
By End-use
By Region
|
| Companies Profiles |
|
| Customization Request | Available upon request |
1. Introduction
1.1. Report Scope
1.2. Market Segmentations and Definitions
1.3. Geographical Coverage
2. Executive Summary
2.1. Key Facts and Figures
2.2. Trends Impacting the Market
2.3. DatasticsR Growth Opportunity Matrix
3. Market Overview
3.1. Global Recycled Copper Market Analysis and Forecast, 2020-2035
3.1.1. Global Recycled Copper Market Size (Tons)
3.1.2. Global Recycled Copper Market Size ($US Bn)
3.2. Supply-side and Demand-side Trends
3.3. Technology Roadmap and Developments
3.4. Market Dynamics
3.4.1. Drivers
3.4.2. Restraints
3.4.3. Opportunities
3.5. Porter’s Five Forces Analysis
3.6. PESTL Analysis
3.7. Industry SWOT Analysis
3.8. Regulatory Landscape
3.9. Value Chain Analysis
3.9.1. List of Waste Collectors
3.9.2. List of Recycling Companies
3.9.3. List of Dealers/Distributors
3.9.4. List of Potential Customers
3.10. Impact of Current Geopolitical Scenario on the Market
4. Technical Analysis
4.1. Product Specification Analysis
4.2. Details of Recycling Process
4.3. Technology Adoption and Emerging Technologies
4.4. R&D Trends and Patents Landscape
4.5. Cost Structure and Profitability Analysis
5. Global Production Output Analysis (Tons), by Region, 2024
5.1. North America
5.2. Europe
5.3. Asia Pacific
5.4. Latin America
5.5. Middle East and Africa
6. Import-export Analysis Volume (Tons) and Value ($US Bn), by Key Country, 2020-2024
7. Price Trend Analysis and Forecasting ($US/Ton), 2020-2035
7.1. Price Trend Analysis and Forecasting, by Source
7.2. Price Trend Analysis and Forecasting, by Region
8. Global Recycled Copper Market Analysis and Forecasting (Tons) ($US Bn), by Source, 2020-2035
9. Global Recycled Copper Market Analysis and Forecasting (Tons) ($US Bn), by Grade, 2020-2035
10. Global Recycled Copper Market Analysis and Forecasting (Tons) ($US Bn), by Recycling Process, 2020-2035
11. Global Recycled Copper Market Analysis and Forecasting (Tons) ($US Bn), by End-use, 2020-2035
12. Global Recycled Copper Market Analysis and Forecasting (Tons) ($US Bn), by Region, 2020-2035
13. North America Recycled Copper Market Analysis and Forecasting (Tons) ($US Bn), by Source, 2020-2035
14. North America Recycled Copper Market Analysis and Forecasting (Tons) ($US Bn), by Grade, 2020-2035
15. North America Recycled Copper Market Analysis and Forecasting (Tons) ($US Bn), by Recycling Process, 2020-2035
16. North America Recycled Copper Market Analysis and Forecasting (Tons) ($US Bn), by End-use, 2020-2035
17. U.S. Recycled Copper Market Analysis and Forecasting (Tons) ($US Bn), by Source, 2020-2035
18. U.S. Recycled Copper Market Analysis and Forecasting (Tons) ($US Bn), by Grade, 2020-2035
19. U.S. Recycled Copper Market Analysis and Forecasting (Tons) ($US Bn), by Recycling Process, 2020-2035
20. U.S. Recycled Copper Market Analysis and Forecasting (Tons) ($US Bn), by End-use, 2020-2035
21. Canada Recycled Copper Market Analysis and Forecasting (Tons) ($US Bn), by Source, 2020-2035
22. Canada Recycled Copper Market Analysis and Forecasting (Tons) ($US Bn), by Grade, 2020-2035
23. Canada Recycled Copper Market Analysis and Forecasting (Tons) ($US Bn), by Recycling Process, 2020-2035
24. Canada Recycled Copper Market Analysis and Forecasting (Tons) ($US Bn), by End-use, 2020-2035
25. Europe Recycled Copper Market Analysis and Forecasting (Tons) ($US Bn), by Source, 2020-2035
26. Europe Recycled Copper Market Analysis and Forecasting (Tons) ($US Bn), by Grade, 2020-2035
27. Europe Recycled Copper Market Analysis and Forecasting (Tons) ($US Bn), by Recycling Process, 2020-2035
28. Europe Recycled Copper Market Analysis and Forecasting (Tons) ($US Bn), by End-use, 2020-2035
29. Germany Recycled Copper Market Analysis and Forecasting (Tons) ($US Bn), by Source, 2020-2035
30. Germany Recycled Copper Market Analysis and Forecasting (Tons) ($US Bn), by Grade, 2020-2035
31. Germany Recycled Copper Market Analysis and Forecasting (Tons) ($US Bn), by Recycling Process, 2020-2035
32. Germany Recycled Copper Market Analysis and Forecasting (Tons) ($US Bn), by End-use, 2020-2035
33. U.K. Recycled Copper Market Analysis and Forecasting (Tons) ($US Bn), by Source, 2020-2035
34. U.K. Recycled Copper Market Analysis and Forecasting (Tons) ($US Bn), by Grade, 2020-2035
35. U.K. Recycled Copper Market Analysis and Forecasting (Tons) ($US Bn), by Recycling Process, 2020-2035
36. U.K. Recycled Copper Market Analysis and Forecasting (Tons) ($US Bn), by End-use, 2020-2035
37. France Recycled Copper Market Analysis and Forecasting (Tons) ($US Bn), by Source, 2020-2035
38. France Recycled Copper Market Analysis and Forecasting (Tons) ($US Bn), by Grade, 2020-2035
39. France Recycled Copper Market Analysis and Forecasting (Tons) ($US Bn), by Recycling Process, 2020-2035
40. France Recycled Copper Market Analysis and Forecasting (Tons) ($US Bn), by End-use, 2020-2035
41. Italy Recycled Copper Market Analysis and Forecasting (Tons) ($US Bn), by Source, 2020-2035
42. Italy Recycled Copper Market Analysis and Forecasting (Tons) ($US Bn), by Grade, 2020-2035
43. Italy Recycled Copper Market Analysis and Forecasting (Tons) ($US Bn), by Recycling Process, 2020-2035
44. Italy Recycled Copper Market Analysis and Forecasting (Tons) ($US Bn), by End-use, 2020-2035
45. Spain Recycled Copper Market Analysis and Forecasting (Tons) ($US Bn), by Source, 2020-2035
46. Spain Recycled Copper Market Analysis and Forecasting (Tons) ($US Bn), by Grade, 2020-2035
47. Spain Recycled Copper Market Analysis and Forecasting (Tons) ($US Bn), by Recycling Process, 2020-2035
48. Spain Recycled Copper Market Analysis and Forecasting (Tons) ($US Bn), by End-use, 2020-2035
49. Russia & CIS Recycled Copper Market Analysis and Forecasting (Tons) ($US Bn), by Source, 2020-2035
50. Russia & CIS Recycled Copper Market Analysis and Forecasting (Tons) ($US Bn), by Grade, 2020-2035
51. Russia & CIS Recycled Copper Market Analysis and Forecasting (Tons) ($US Bn), by Recycling Process, 2020-2035
52. Russia & CIS Recycled Copper Market Analysis and Forecasting (Tons) ($US Bn), by End-use, 2020-2035
53. Rest of Europe Recycled Copper Market Analysis and Forecasting (Tons) ($US Bn), by Source, 2020-2035
54. Rest of Europe Recycled Copper Market Analysis and Forecasting (Tons) ($US Bn), by Grade, 2020-2035
55. Rest of Europe Recycled Copper Market Analysis and Forecasting (Tons) ($US Bn), by Recycling Process, 2020-2035
56. Rest of Europe Recycled Copper Market Analysis and Forecasting (Tons) ($US Bn), by End-use, 2020-2035
57. Asia Pacific Recycled Copper Market Analysis and Forecasting (Tons) ($US Bn), by Source, 2020-2035
58. Asia Pacific Recycled Copper Market Analysis and Forecasting (Tons) ($US Bn), by Grade, 2020-2035
59. Asia Pacific Recycled Copper Market Analysis and Forecasting (Tons) ($US Bn), by Recycling Process, 2020-2035
60. Asia Pacific Recycled Copper Market Analysis and Forecasting (Tons) ($US Bn), by End-use, 2020-2035
61. China Recycled Copper Market Analysis and Forecasting (Tons) ($US Bn), by Source, 2020-2035
62. China Recycled Copper Market Analysis and Forecasting (Tons) ($US Bn), by Grade, 2020-2035
63. China Recycled Copper Market Analysis and Forecasting (Tons) ($US Bn), by Recycling Process, 2020-2035
64. China Recycled Copper Market Analysis and Forecasting (Tons) ($US Bn), by End-use, 2020-2035
65. India Recycled Copper Market Analysis and Forecasting (Tons) ($US Bn), by Source, 2020-2035
66. India Recycled Copper Market Analysis and Forecasting (Tons) ($US Bn), by Grade, 2020-2035
67. India Recycled Copper Market Analysis and Forecasting (Tons) ($US Bn), by Recycling Process, 2020-2035
68. India Recycled Copper Market Analysis and Forecasting (Tons) ($US Bn), by End-use, 2020-2035
69. Japan Recycled Copper Market Analysis and Forecasting (Tons) ($US Bn), by Source, 2020-2035
70. Japan Recycled Copper Market Analysis and Forecasting (Tons) ($US Bn), by Grade, 2020-2035
71. Japan Recycled Copper Market Analysis and Forecasting (Tons) ($US Bn), by Recycling Process, 2020-2035
72. Japan Recycled Copper Market Analysis and Forecasting (Tons) ($US Bn), by End-use, 2020-2035
73. South Korea Recycled Copper Market Analysis and Forecasting (Tons) ($US Bn), by Source, 2020-2035
74. South Korea Recycled Copper Market Analysis and Forecasting (Tons) ($US Bn), by Grade, 2020-2035
75. South Korea Recycled Copper Market Analysis and Forecasting (Tons) ($US Bn), by Recycling Process, 2020-2035
76. South Korea Recycled Copper Market Analysis and Forecasting (Tons) ($US Bn), by End-use, 2020-2035
77. Taiwan Recycled Copper Market Analysis and Forecasting (Tons) ($US Bn), by Source, 2020-2035
78. Taiwan Recycled Copper Market Analysis and Forecasting (Tons) ($US Bn), by Grade, 2020-2035
79. Taiwan Recycled Copper Market Analysis and Forecasting (Tons) ($US Bn), by Fabrication Technology, 2020-2035
80. Taiwan Recycled Copper Market Analysis and Forecasting (Tons) ($US Bn), by Recycling Process, 2020-2035
81. Taiwan Recycled Copper Market Analysis and Forecasting (Tons) ($US Bn), by End-use, 2020-2035
82. Australia Recycled Copper Market Analysis and Forecasting (Tons) ($US Bn), by Source, 2020-2035
83. Australia Recycled Copper Market Analysis and Forecasting (Tons) ($US Bn), by Grade, 2020-2035
84. Australia Recycled Copper Market Analysis and Forecasting (Tons) ($US Bn), by Fabrication Technology, 2020-2035
85. Australia Recycled Copper Market Analysis and Forecasting (Tons) ($US Bn), by Recycling Process, 2020-2035
86. Australia Recycled Copper Market Analysis and Forecasting (Tons) ($US Bn), by End-use, 2020-2035
87. ASEAN Recycled Copper Market Analysis and Forecasting (Tons) ($US Bn), by Source, 2020-2035
88. ASEAN Recycled Copper Market Analysis and Forecasting (Tons) ($US Bn), by Grade, 2020-2035
89. ASEAN Recycled Copper Market Analysis and Forecasting (Tons) ($US Bn), by Recycling Process, 2020-2035
90. ASEAN Recycled Copper Market Analysis and Forecasting (Tons) ($US Bn), by End-use, 2020-2035
91. Rest of Asia Pacific Recycled Copper Market Analysis and Forecasting (Tons) ($US Bn), by Source, 2020-2035
92. Rest of Asia Pacific Recycled Copper Market Analysis and Forecasting (Tons) ($US Bn), by Grade, 2020-2035
93. Rest of Asia Pacific Recycled Copper Market Analysis and Forecasting (Tons) ($US Bn), by Recycling Process, 2020-2035
94. Rest of Asia Pacific Recycled Copper Market Analysis and Forecasting (Tons) ($US Bn), by End-use, 2020-2035
95. Latin America Recycled Copper Market Analysis and Forecasting (Tons) ($US Bn), by Source, 2020-2035
96. Latin America Recycled Copper Market Analysis and Forecasting (Tons) ($US Bn), by Grade, 2020-2035
97. Latin America Recycled Copper Market Analysis and Forecasting (Tons) ($US Bn), by Recycling Process, 2020-2035
98. Latin America Recycled Copper Market Analysis and Forecasting (Tons) ($US Bn), by End-use, 2020-2035
99. Mexico Recycled Copper Market Analysis and Forecasting (Tons) ($US Bn), by Source, 2020-2035
100. Mexico Recycled Copper Market Analysis and Forecasting (Tons) ($US Bn), by Grade, 2020-2035
101. Mexico Recycled Copper Market Analysis and Forecasting (Tons) ($US Bn), by Recycling Process, 2020-2035
102. Mexico Recycled Copper Market Analysis and Forecasting (Tons) ($US Bn), by End-use, 2020-2035
103. Brazil Recycled Copper Market Analysis and Forecasting (Tons) ($US Bn), by Source, 2020-2035
104. Brazil Recycled Copper Market Analysis and Forecasting (Tons) ($US Bn), by Grade, 2020-2035
105. Brazil Recycled Copper Market Analysis and Forecasting (Tons) ($US Bn), by Recycling Process, 2020-2035
106. Brazil Recycled Copper Market Analysis and Forecasting (Tons) ($US Bn), by End-use, 2020-2035
107. Argentina Recycled Copper Market Analysis and Forecasting (Tons) ($US Bn), by Source, 2020-2035
108. Argentina Recycled Copper Market Analysis and Forecasting (Tons) ($US Bn), by Grade, 2020-2035
109. Argentina Recycled Copper Market Analysis and Forecasting (Tons) ($US Bn), by Recycling Process, 2020-2035
110. Argentina Recycled Copper Market Analysis and Forecasting (Tons) ($US Bn), by End-use, 2020-2035
111. Rest of Latin America Recycled Copper Market Analysis and Forecasting (Tons) ($US Bn), by Source, 2020-2035
112. Rest of Latin America Recycled Copper Market Analysis and Forecasting (Tons) ($US Bn), by Grade, 2020-2035
113. Rest of Latin America Recycled Copper Market Analysis and Forecasting (Tons) ($US Bn), by Recycling Process, 2020-2035
114. Rest of Latin America Recycled Copper Market Analysis and Forecasting (Tons) ($US Bn), by End-use, 2020-2035
115. Middle East and Africa Recycled Copper Market Analysis and Forecasting (Tons) ($US Bn), by Source, 2020-2035
116. Middle East and Africa Recycled Copper Market Analysis and Forecasting (Tons) ($US Bn), by Grade, 2020-2035
117. Middle East and Africa Recycled Copper Market Analysis and Forecasting (Tons) ($US Bn), by Recycling Process, 2020-2035
118. Middle East and Africa Recycled Copper Market Analysis and Forecasting (Tons) ($US Bn), by End-use, 2020-2035
119. Saudi Arabia Recycled Copper Market Analysis and Forecasting (Tons) ($US Bn), by Source, 2020-2035
120. Saudi Arabia Recycled Copper Market Analysis and Forecasting (Tons) ($US Bn), by Grade, 2020-2035
121. Saudi Arabia Recycled Copper Market Analysis and Forecasting (Tons) ($US Bn), by Recycling Process, 2020-2035
122. Saudi Arabia Recycled Copper Market Analysis and Forecasting (Tons) ($US Bn), by End-use, 2020-2035
123. UAE Recycled Copper Market Analysis and Forecasting (Tons) ($US Bn), by Source, 2020-2035
124. UAE Recycled Copper Market Analysis and Forecasting (Tons) ($US Bn), by Grade, 2020-2035
125. UAE Recycled Copper Market Analysis and Forecasting (Tons) ($US Bn), by Recycling Process, 2020-2035
126. UAE Recycled Copper Market Analysis and Forecasting (Tons) ($US Bn), by End-use, 2020-2035
127. South Africa Recycled Copper Market Analysis and Forecasting (Tons) ($US Bn), by Source, 2020-2035
128. South Africa Recycled Copper Market Analysis and Forecasting (Tons) ($US Bn), by Grade, 2020-2035
129. South Africa Recycled Copper Market Analysis and Forecasting (Tons) ($US Bn), by Recycling Process, 2020-2035
130. South Africa Recycled Copper Market Analysis and Forecasting (Tons) ($US Bn), by End-use, 2020-2035
131. Rest of Middle East and Africa Recycled Copper Market Analysis and Forecasting (Tons) ($US Bn), by Source, 2020-2035
132. Rest of Middle East and Africa Recycled Copper Market Analysis and Forecasting (Tons) ($US Bn), by Grade, 2020-2035
133. Rest of Middle East and Africa Recycled Copper Market Analysis and Forecasting (Tons) ($US Bn), by Recycling Process, 2020-2035
134. Rest of Middle East and Africa Recycled Copper Market Analysis and Forecasting (Tons) ($US Bn), by End-use, 2020-2035
135. Competition Landscape
135.1. Market Share Analysis (%), by Company, 2024
135.2. Competitive Benchmarking
135.3. Company Profiles
135.3.1. Aurubis AG
135.3.1.1. Company Overview
135.3.1.2. Product Portfolio
135.3.1.3. Financials
135.3.1.4. Geographical Footprint
135.3.1.5. SWOT Analysis
135.3.1.6. Recent Developments and Strategies
135.3.2. Commercial Metals Company
135.3.2.1. Company Overview
135.3.2.2. Product Portfolio
135.3.2.3. Financials
135.3.2.4. Geographical Footprint
135.3.2.5. SWOT Analysis
135.3.2.6. Recent Developments and Strategies
135.3.3. Schnitzer Steel Industries, Inc.
135.3.3.1. Company Overview
135.3.3.2. Product Portfolio
135.3.3.3. Financials
135.3.3.4. Geographical Footprint
135.3.3.5. SWOT Analysis
135.3.3.6. Recent Developments and Strategies
135.3.4. Umicore N.V.
135.3.4.1. Company Overview
135.3.4.2. Product Portfolio
135.3.4.3. Financials
135.3.4.4. Geographical Footprint
135.3.4.5. SWOT Analysis
135.3.4.6. Recent Developments and Strategies
135.3.5. Kuusakoski Group Oy
135.3.5.1. Company Overview
135.3.5.2. Product Portfolio
135.3.5.3. Financials
135.3.5.4. Geographical Footprint
135.3.5.5. SWOT Analysis
135.3.5.6. Recent Developments and Strategies
135.3.6. Sims Metal Management Ltd.
135.3.6.1. Company Overview
135.3.6.2. Product Portfolio
135.3.6.3. Financials
135.3.6.4. Geographical Footprint
135.3.6.5. SWOT Analysis
135.3.6.6. Recent Developments and Strategies
135.3.7. OmniSource, LLC
135.3.7.1. Company Overview
135.3.7.2. Product Portfolio
135.3.7.3. Financials
135.3.7.4. Geographical Footprint
135.3.7.5. SWOT Analysis
135.3.7.6. Recent Developments and Strategies
135.3.8. Elgin Recycling
135.3.8.1. Company Overview
135.3.8.2. Product Portfolio
135.3.8.3. Financials
135.3.8.4. Geographical Footprint
135.3.8.5. SWOT Analysis
135.3.8.6. Recent Developments and Strategies
135.3.9. Elgin Recycling
135.3.9.1. Company Overview
135.3.9.2. Product Portfolio
135.3.9.3. Financials
135.3.9.4. Geographical Footprint
135.3.9.5. SWOT Analysis
135.3.9.6. Recent Developments and Strategies
135.3.10. Pacific Metal Pty Ltd
135.3.10.1. Company Overview
135.3.10.2. Product Portfolio
135.3.10.3. Financials
135.3.10.4. Geographical Footprint
135.3.10.5. SWOT Analysis
135.3.10.6. Recent Developments and Strategies
135.3.11. Universal Recycling
135.3.11.1. Company Overview
135.3.11.2. Product Portfolio
135.3.11.3. Financials
135.3.11.4. Geographical Footprint
135.3.11.5. SWOT Analysis
135.3.11.6. Recent Developments and Strategies
135.3.12. Wilton Recycling
135.3.12.1. Company Overview
135.3.12.2. Product Portfolio
135.3.12.3. Financials
135.3.12.4. Geographical Footprint
135.3.12.5. SWOT Analysis
135.3.12.6. Recent Developments and Strategies
135.3.13. LKM Recycling
135.3.13.1. Company Overview
135.3.13.2. Product Portfolio
135.3.13.3. Financials
135.3.13.4. Geographical Footprint
135.3.13.5. SWOT Analysis
135.3.13.6. Recent Developments and Strategies
135.3.14. European Recycled Metal
135.3.14.1. Company Overview
135.3.14.2. Product Portfolio
135.3.14.3. Financials
135.3.14.4. Geographical Footprint
135.3.14.5. SWOT Analysis
135.3.14.6. Recent Developments and Strategies
135.3.15. SA Recycling LLC
135.3.15.1. Company Overview
135.3.15.2. Product Portfolio
135.3.15.3. Financials
135.3.15.4. Geographical Footprint
135.3.15.5. SWOT Analysis
135.3.15.6. Recent Developments and Strategies
135.3.16. Aaron Metals
135.3.16.1. Company Overview
135.3.16.2. Product Portfolio
135.3.16.3. Financials
135.3.16.4. Geographical Footprint
135.3.16.5. SWOT Analysis
135.3.16.6. Recent Developments and Strategies
135.3.17. Others
136. Appendix
- Get Started -
Get insights that lead to new growth opportunities
- Talk to Experts -
Get answers to your queries on this report from our experts
Frequently Asked Questions
The global recycled copper market in 2024 was $US 53.8 billion.
The global recycled copper market will be $US 95.9 billion by 2035.
The expected growth rate (CAGR%) of the global recycled copper market is 5.4% for the period 2025-2035.
Rising Demand from Renewable Energy and Electric Vehicles and Stringent Government Regulations and ESG Goals are Promoting Large-scale Copper Recycling.
Building and constriction was the largest application segmentation of recycled copper market in 2024.
Asia Pacific was the leading regions for recycled copper holding around 52% of market share the global market in 2024.
Aurubis AG, Commercial Metals Company, Schnitzer Steel Industries, Inc., Umicore N.V., Kuusakoski Group Oy, Sims Metal Management Ltd., OmniSource, LLC, Elgin Recycling, Elgin Recycling, Pacific Metal Pty Ltd, Universal Recycling, Wilton Recycling, LKM Recycling, European Recycled Metal, SA Recycling LLC, Aaron Metals, and Others.